

YOUTUBE: A LANDSCAPE
Creators vs Corporations vs Long vs Shorts

Happy Monday Peaceniks. Ready to get filtered?
This year, we’ve spent a lot of time and energy studying the Media Generation Gap — between audiences Millennial and younger, and those GenX and older. This spring, we partnered with Tubefilter for a study of Media’s biggest video platform: YouTube. They granted us unique access to their YouTube analytics and generated a dataset, based on our prompts, for this report:
YOUTUBE: A LANDSCAPE ANALYSIS
It’s important to note that YouTube data is volatile. Since each channel owner totally controls their channel’s content, and since traffic counts can shift dramatically if videos are moved, removed, or made private; since subscriptions on the main platform are free, and since sub numbers can skyrocket or plummet in any given week, depending on content or marketing; creating ongoing tracking analytics across tens of millions of channels is difficult-if-not-near-impossible. Plus, analyzing viewership across those millions of channels as a third party, from outside YouTube, makes the effort even more complicated.
Of the tens of millions of channels on YouTube, there are at least 4.6 million channels Tubefilter defines as "active" — with at least 1,000 lifetime subscribers, one uploaded video in the last 90 days, and 100 channel views within the last 90 days. Our study focuses on those 4.6 million channels. Parsing long-form “proper YouTube” videos from YouTube Shorts is also quite complex. Depending on individual channel management, view counts can swing widely and wildly. To give us a true apples-to-apples comparison among the top channels, and to count long-form video views as differentiated from Shorts, Tubefilter generated data for average views per new video posted in the last 30 days.
For our study, we wanted to zoom out and get a global view of channel performance — across regions and comparing total views to views without Shorts. Even given the data’s complexities, the findings are illuminating and instructive to better understand the world’s biggest video platform and fastest growing TV channel.

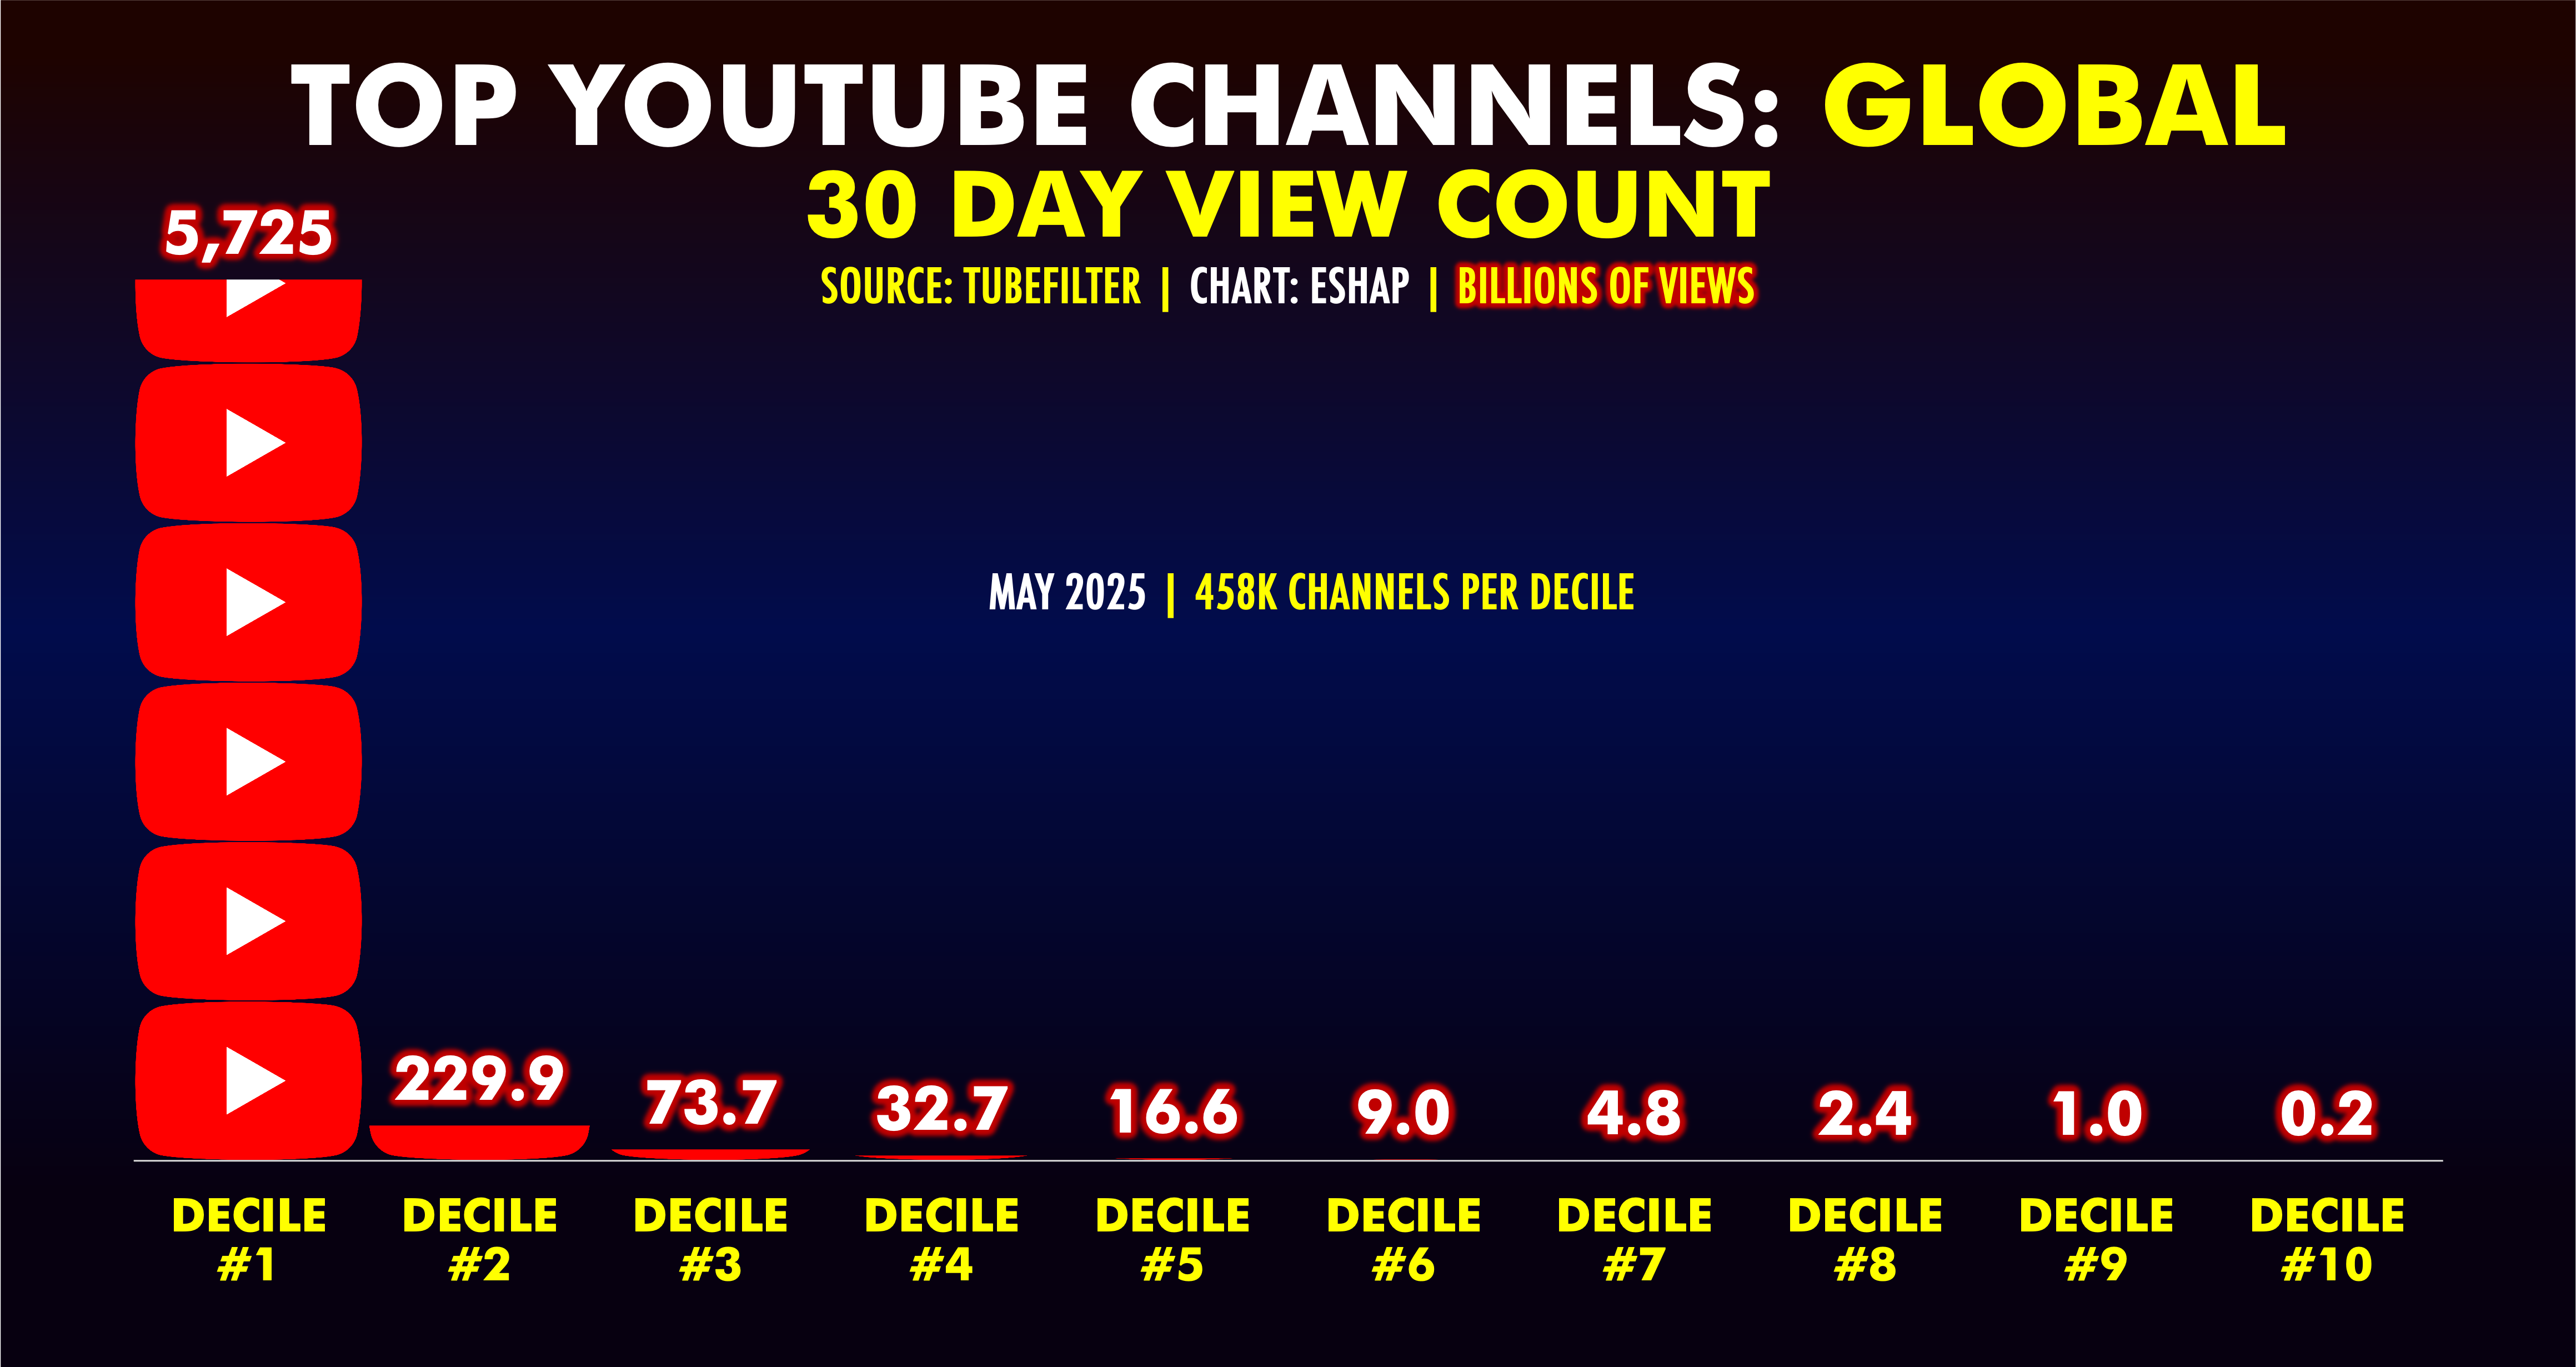
For the 30 days ending on May 22, the 4.6 million "active" channels on YouTube generated nearly 6.1 trillion views. 5.7 trillion of those views came from the top decile — the top 458K channels — with 12.5 million views per channel over those 30 days. The bottom decile (the last 458K channels) generated 242 million views, or just 529 views per channel.
The data here goes beyond conventional 80/20 math — wherein 80% of any usage comes from the top 20% of power users. On YouTube, the top 10% of channels generate approximately 94% of views. The top two deciles — the top 20% of all channels — garner 97.7% of all YouTube views over 30 days.
Those top two tranches represent nine hundred and seventeen thousand channels, with an average view count of 6.5 million. The last eight deciles represent 3.67 million channels with an average of just 32K views for the month. Which brings us to the first lesson learned from this data:
ON YOUTUBE, THE WORLD’S BIGGEST VIDEO CHANNEL, 4.6 MILLION ‘ACTIVE’ CHANNELS SHARE TRILLIONS OF VIEWS EACH MONTH. ERGO, THE THREE MOST IMPORTANT WORDS OF THE USER-CENTRIC ERA ARE: FRAGMENTATION, FRAGMENTATION, FRAGMENTATION
When we dig specifically into what the channels are, more learnings emerge.

