


Happy Hump Day War & Peaceniks!

On Monday, I wrote a guest column for VideoWeek about the Screen Wars: the battle for dominance in the Connected TV market. I assessed the data from Conviva’s latest State of Streaming Report, showing the year-on-year shifts in power behind the screens of your TVs. As the chart below shows, streaming share is shifting from dongles - external streaming devices - to smart screens.
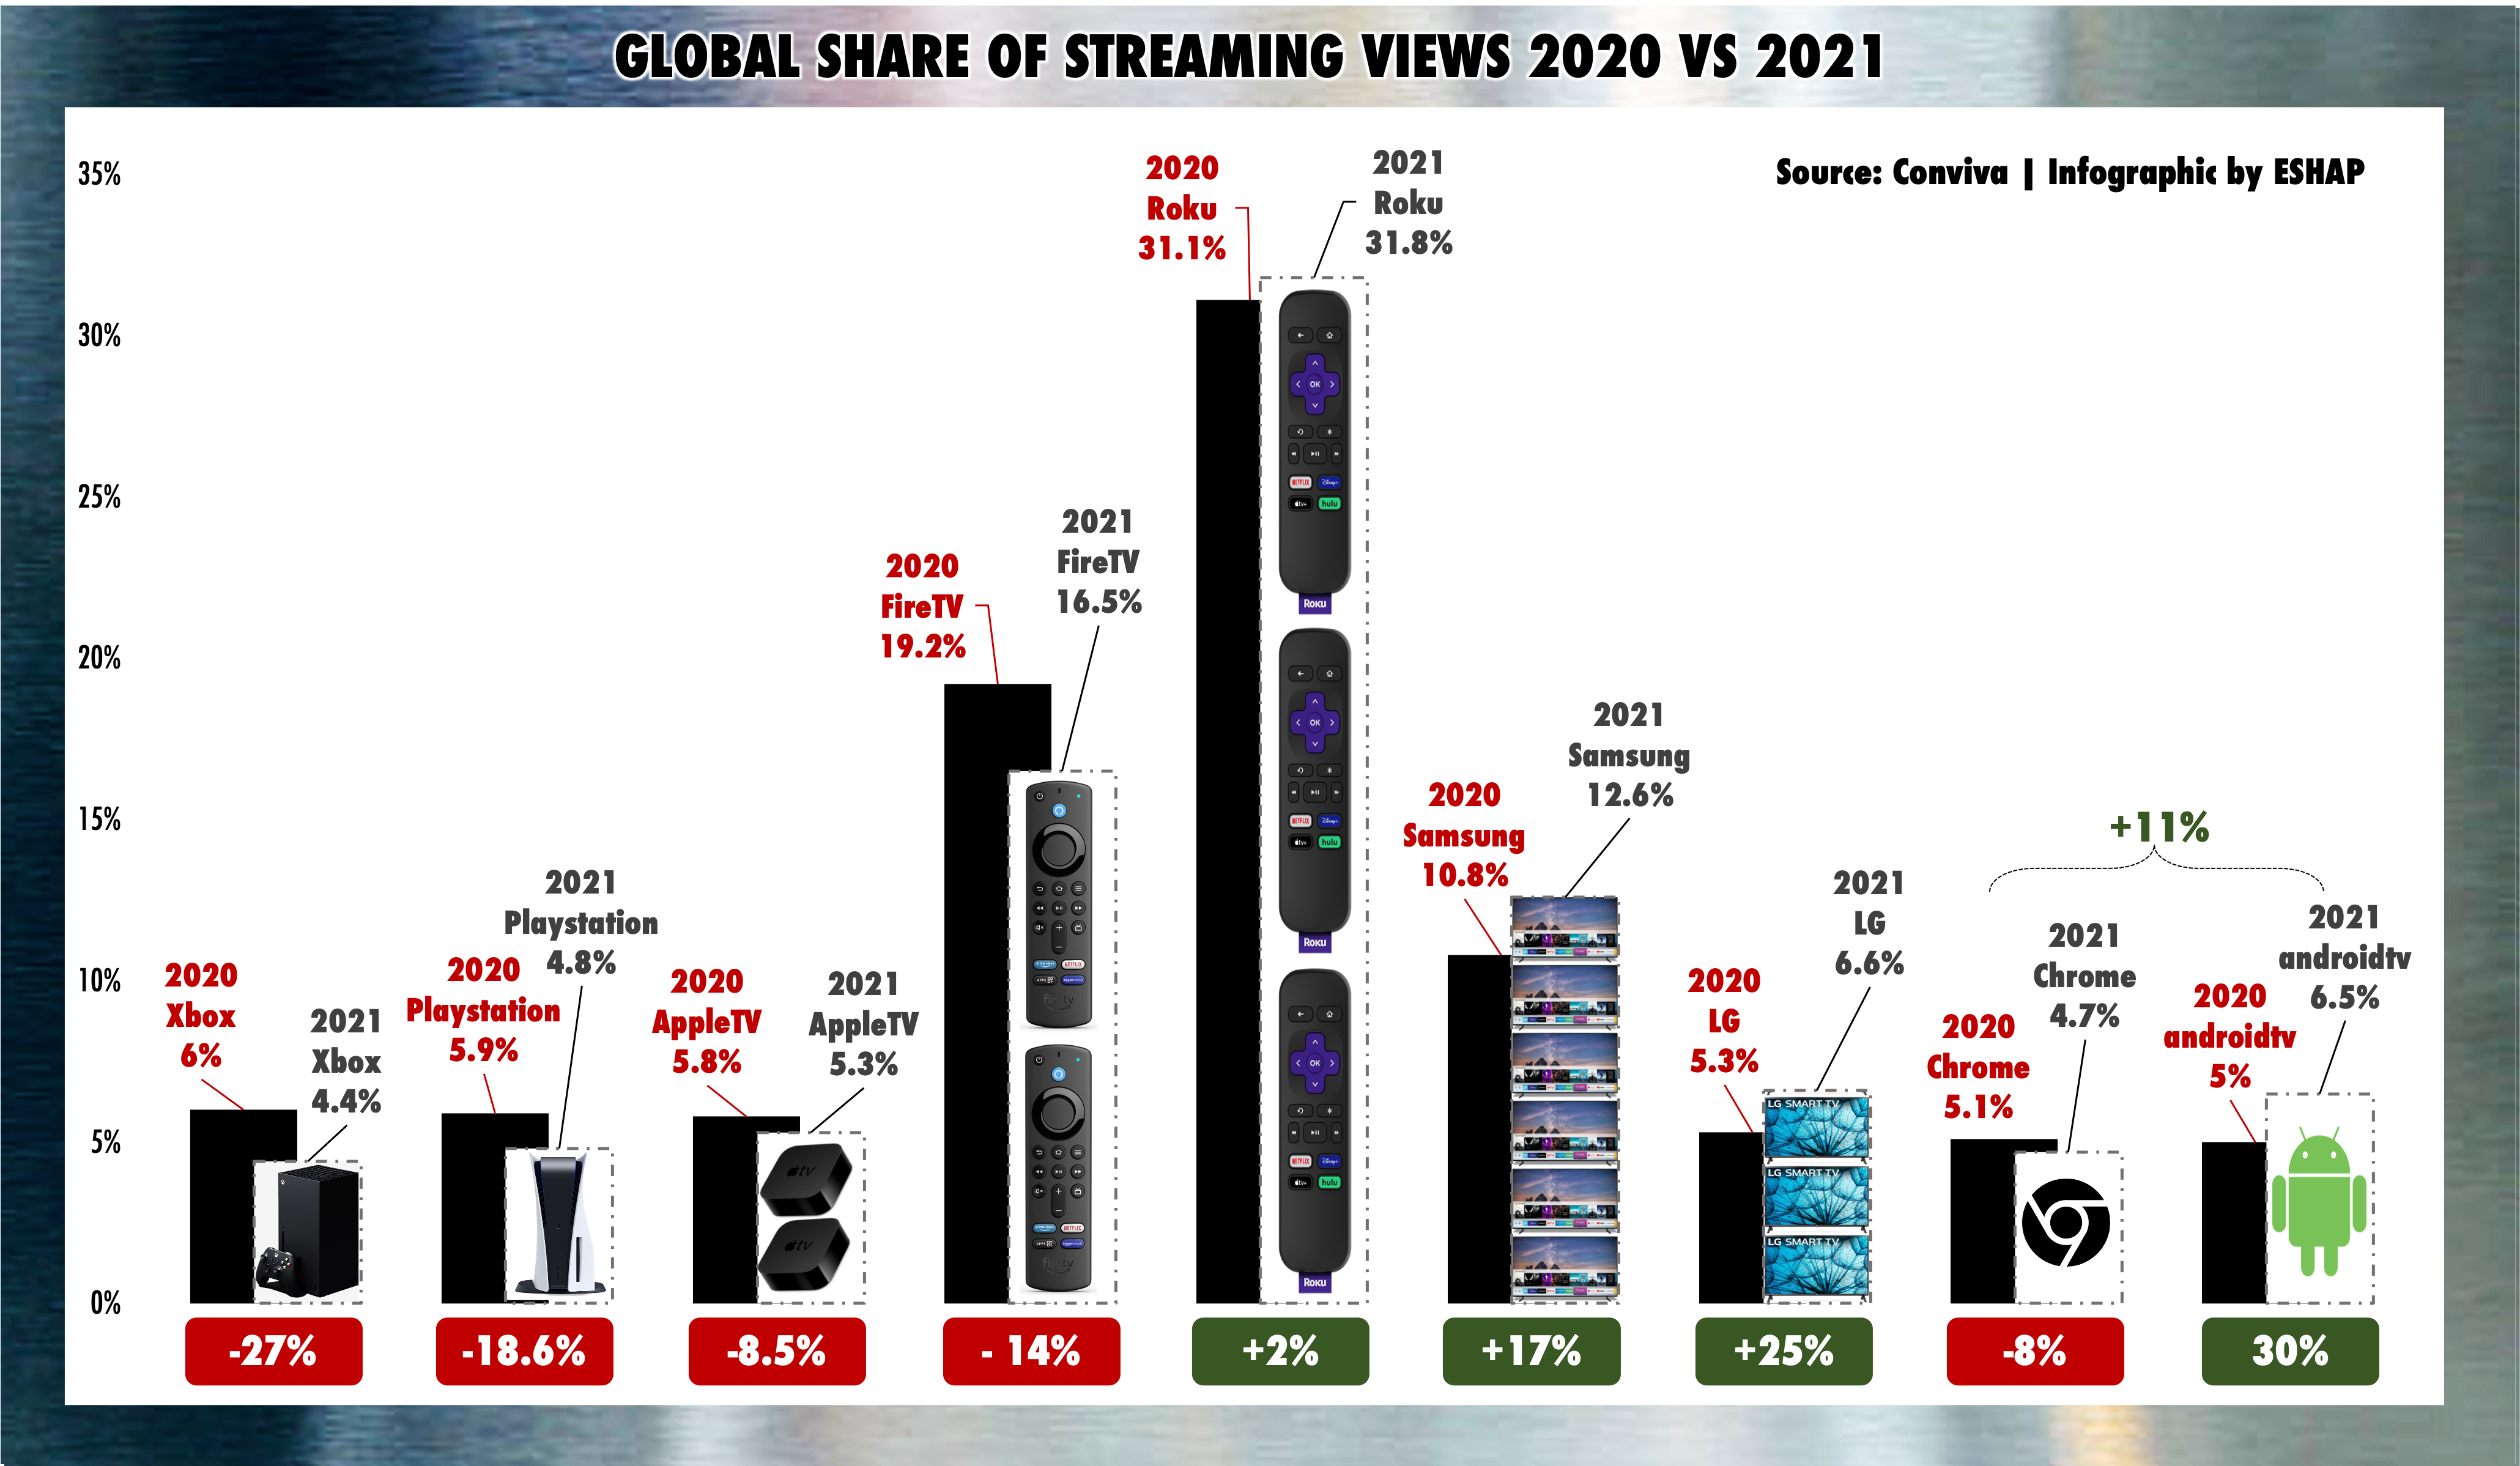
Roku’s massive streaming advantage in the US (41% market share in America) translates to a worldwide streaming lead at 31.8% share. As I said in VideoWeek, a shift from dongles and plug-ins to smart screens has given momentum to LG, Samsung and Android-powered CTVs.
What’s most important about these streaming market shares is not how many devices are being sold, but how much revenue this streaming generates per user, after the devices are unboxed.
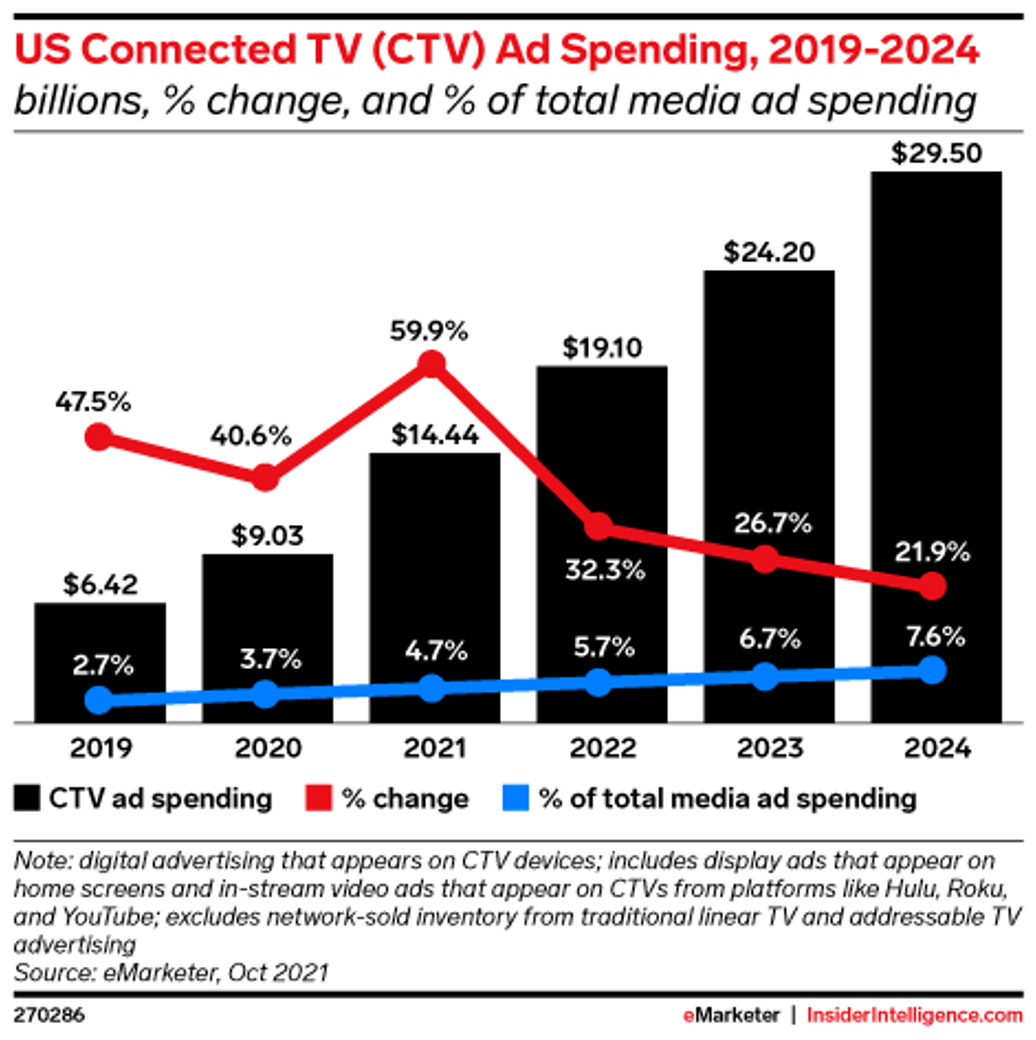
This year the CTV ad market will generate $19.1 billion. By 2024, $29.5 billion will be spent on CTV advertising - IMHO, this number is conservative. 750 million CTVs will be sold worldwide in the next three years, creating new audiences for streaming on connected TVs and for the ads running on them.
Additionally, the quality of these streaming platforms, the data they produce (which sucks eggs right now) and the environments in which CTV ads run, will all improve greatly, making the market that much more important to advertisers.
Now, using data from Pixalate, I’ve charted how this streaming converts to benjamins. The infographic below charts the share of Connected TV Advertising on CTV devices - and tracks the shifts in that revenue from 2020 to 2021.
Keep reading with a 7-day free trial
Subscribe to Media War & Peace to keep reading this post and get 7 days of free access to the full post archives.