

TRAD MEDIA: AN AUTOPSY
A Full Investigation into the Death of Legacy TV

PARIS, FRANCE (July 8, 2026) — Today, just as Trad TV drops its Emmy nominations in the US, I will take the stage at the annual France Télévisions Conférence de Rentrée… to dissect a corpse.
Below, please find my official autopsy of Traditional Media as we know it.
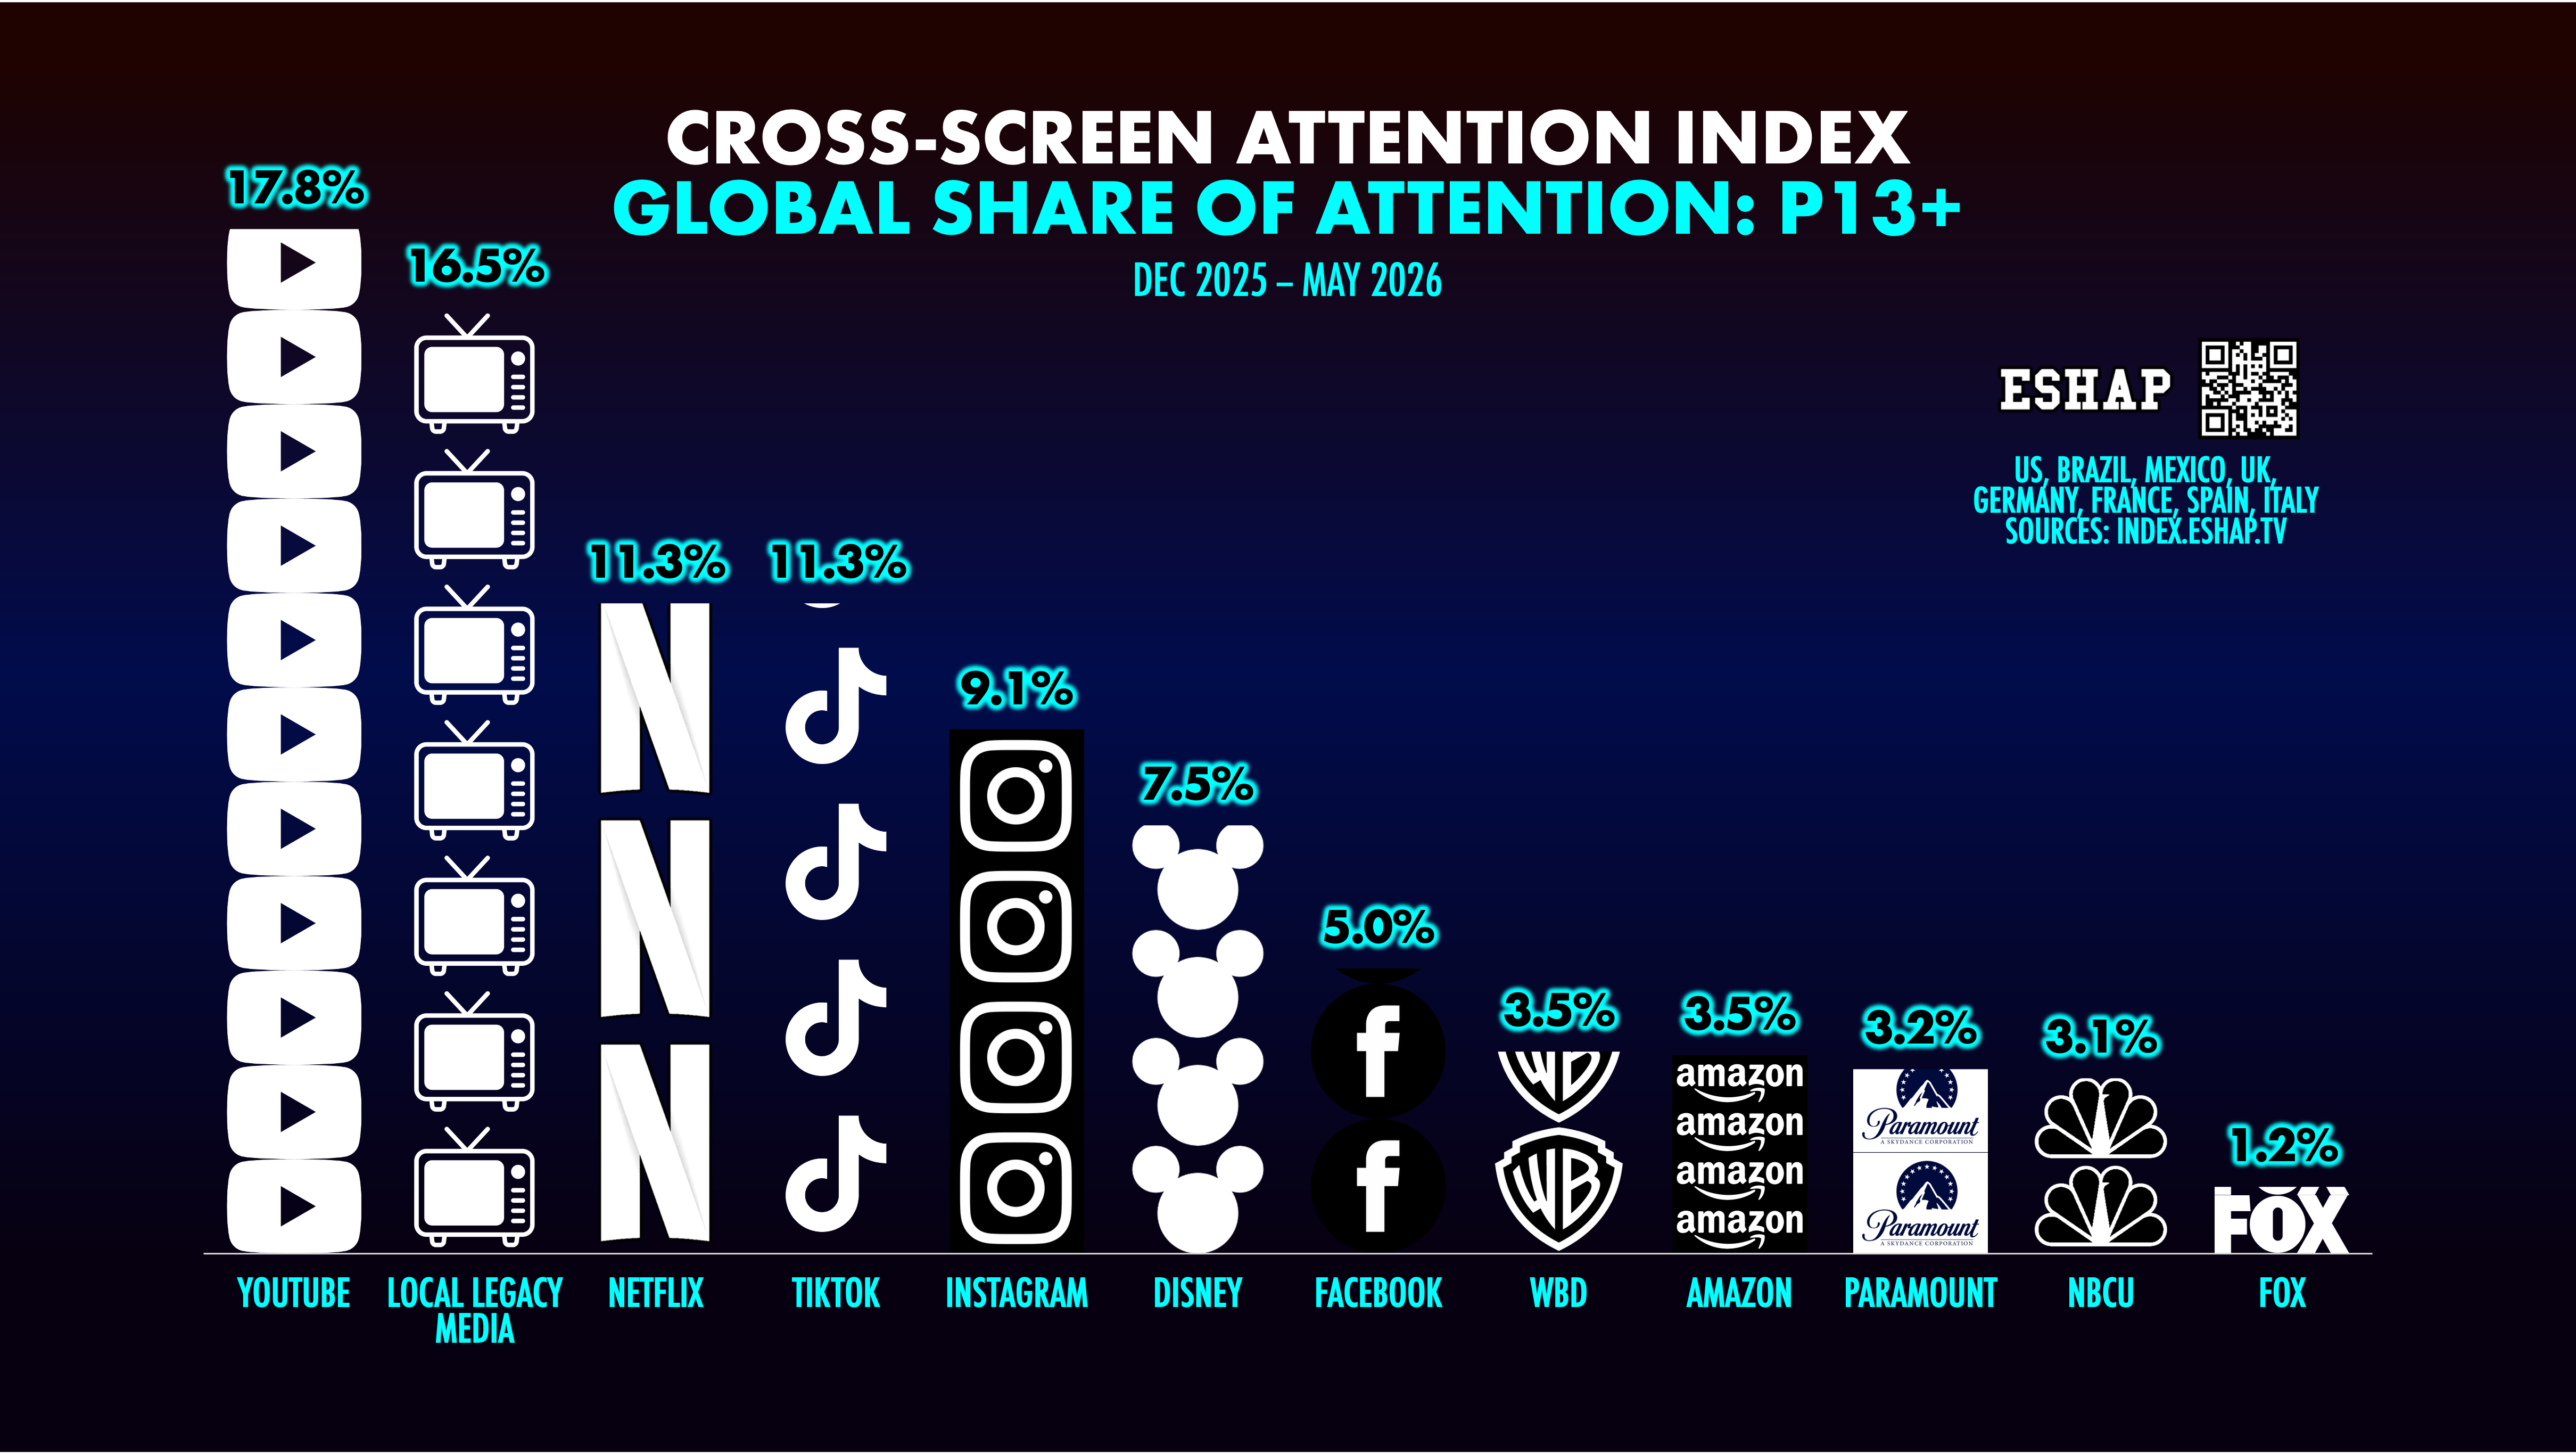
These 👆 are the results of a massive, Media measurement mission: Create a global cross-screen index to track the total attention of today’s consumers, regardless of which screen they use, across all the generations of the planet.
THE ESHAP CROSS-SCREEN ATTENTION INDEX — a FREE, interactive dashboard for global attention, across eight countries (US, UK, Brazil, Mexico, Germany, France, Spain, and Italy) — is NOW LIVE AND ONLINE.
(To play along, take a sec and open another window and pull up The Index now.)

Look at this chart again.
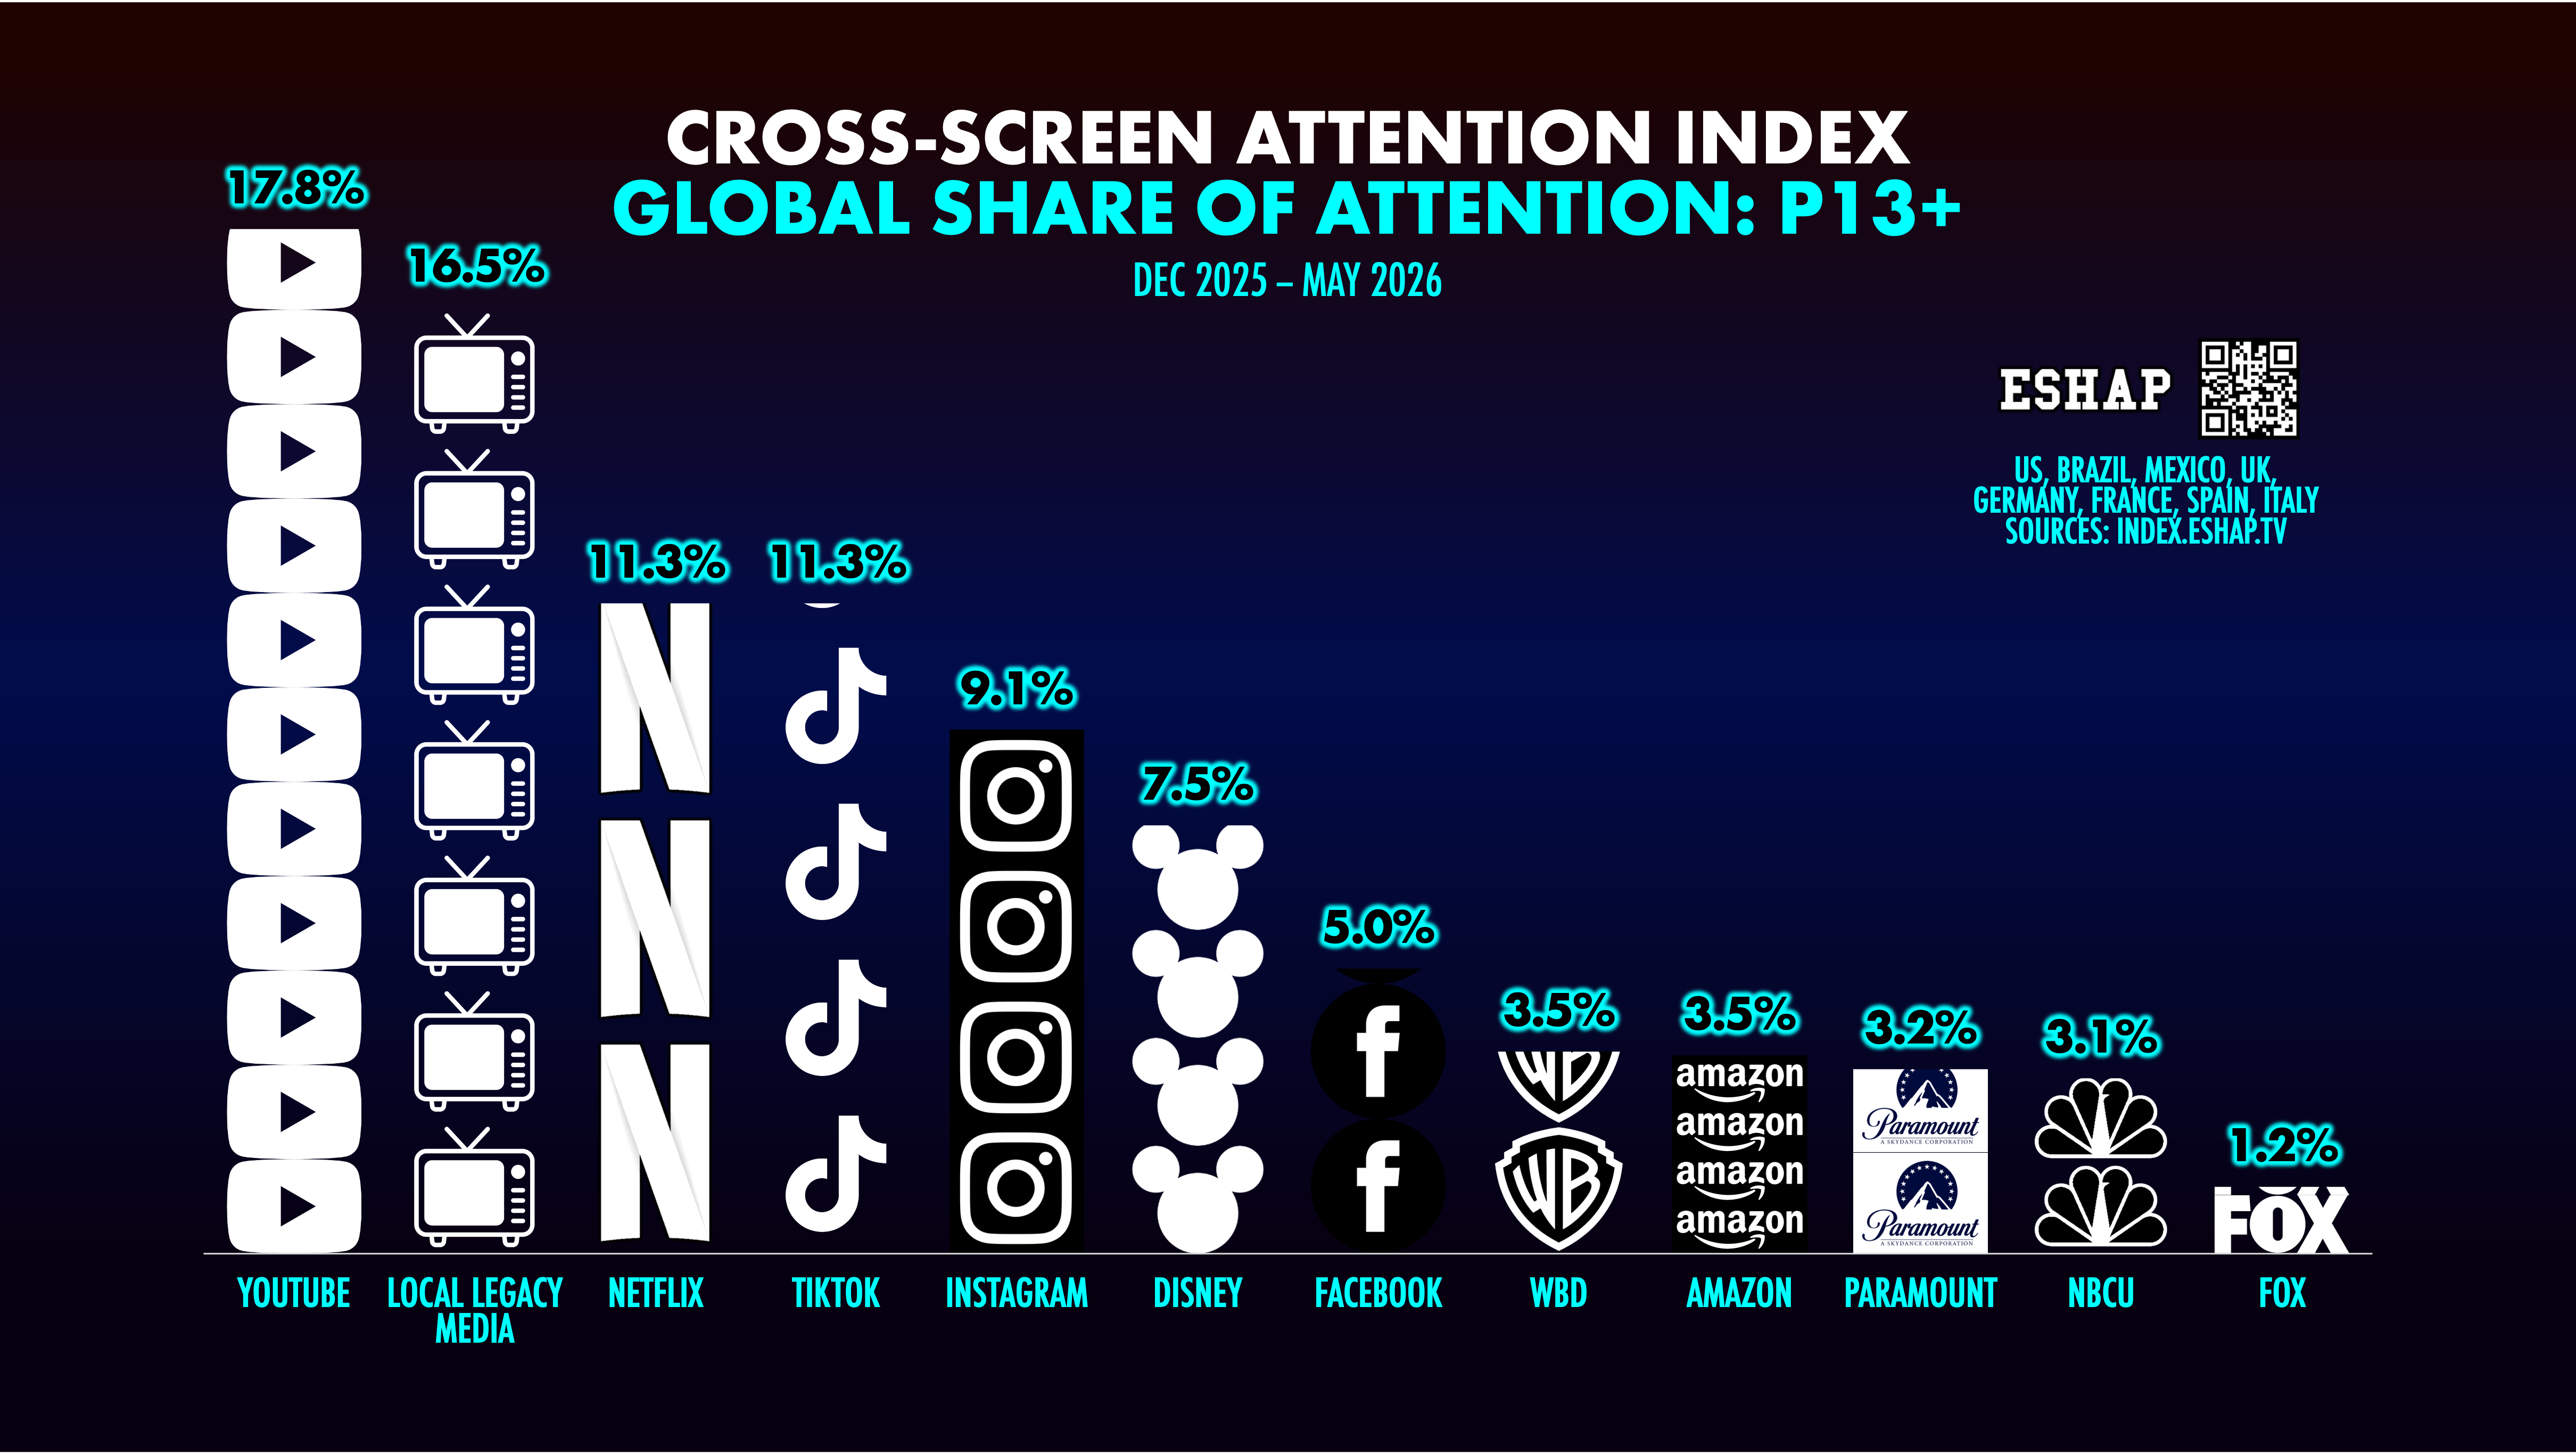
This is the share of consumer attention, across these eight major regions, for all people 13+.
Note that the Local Legacy Media index is a combo of ALL local traditional Media from these eight nations, compared to the rest of the global players on the chart. Note also that for total attention, all fourteen of the Legacy Media platforms, combined across all eight regions, lose the battle for cross-screen attention to the global attention champ, YouTube.
If you decouple all the trad media, the top four platforms for total cross-screen consumer attention, for all people Bar Mitzvah or older, are: 1. YouTube, 2. Netflix, 3. TikTok, and 4. Instagram.
More importantly, this is total attention paid, from all people 13+ in these regions. When we ZOOM IN and look at how the majority of humans on earth consume media… it looks like this 👇.
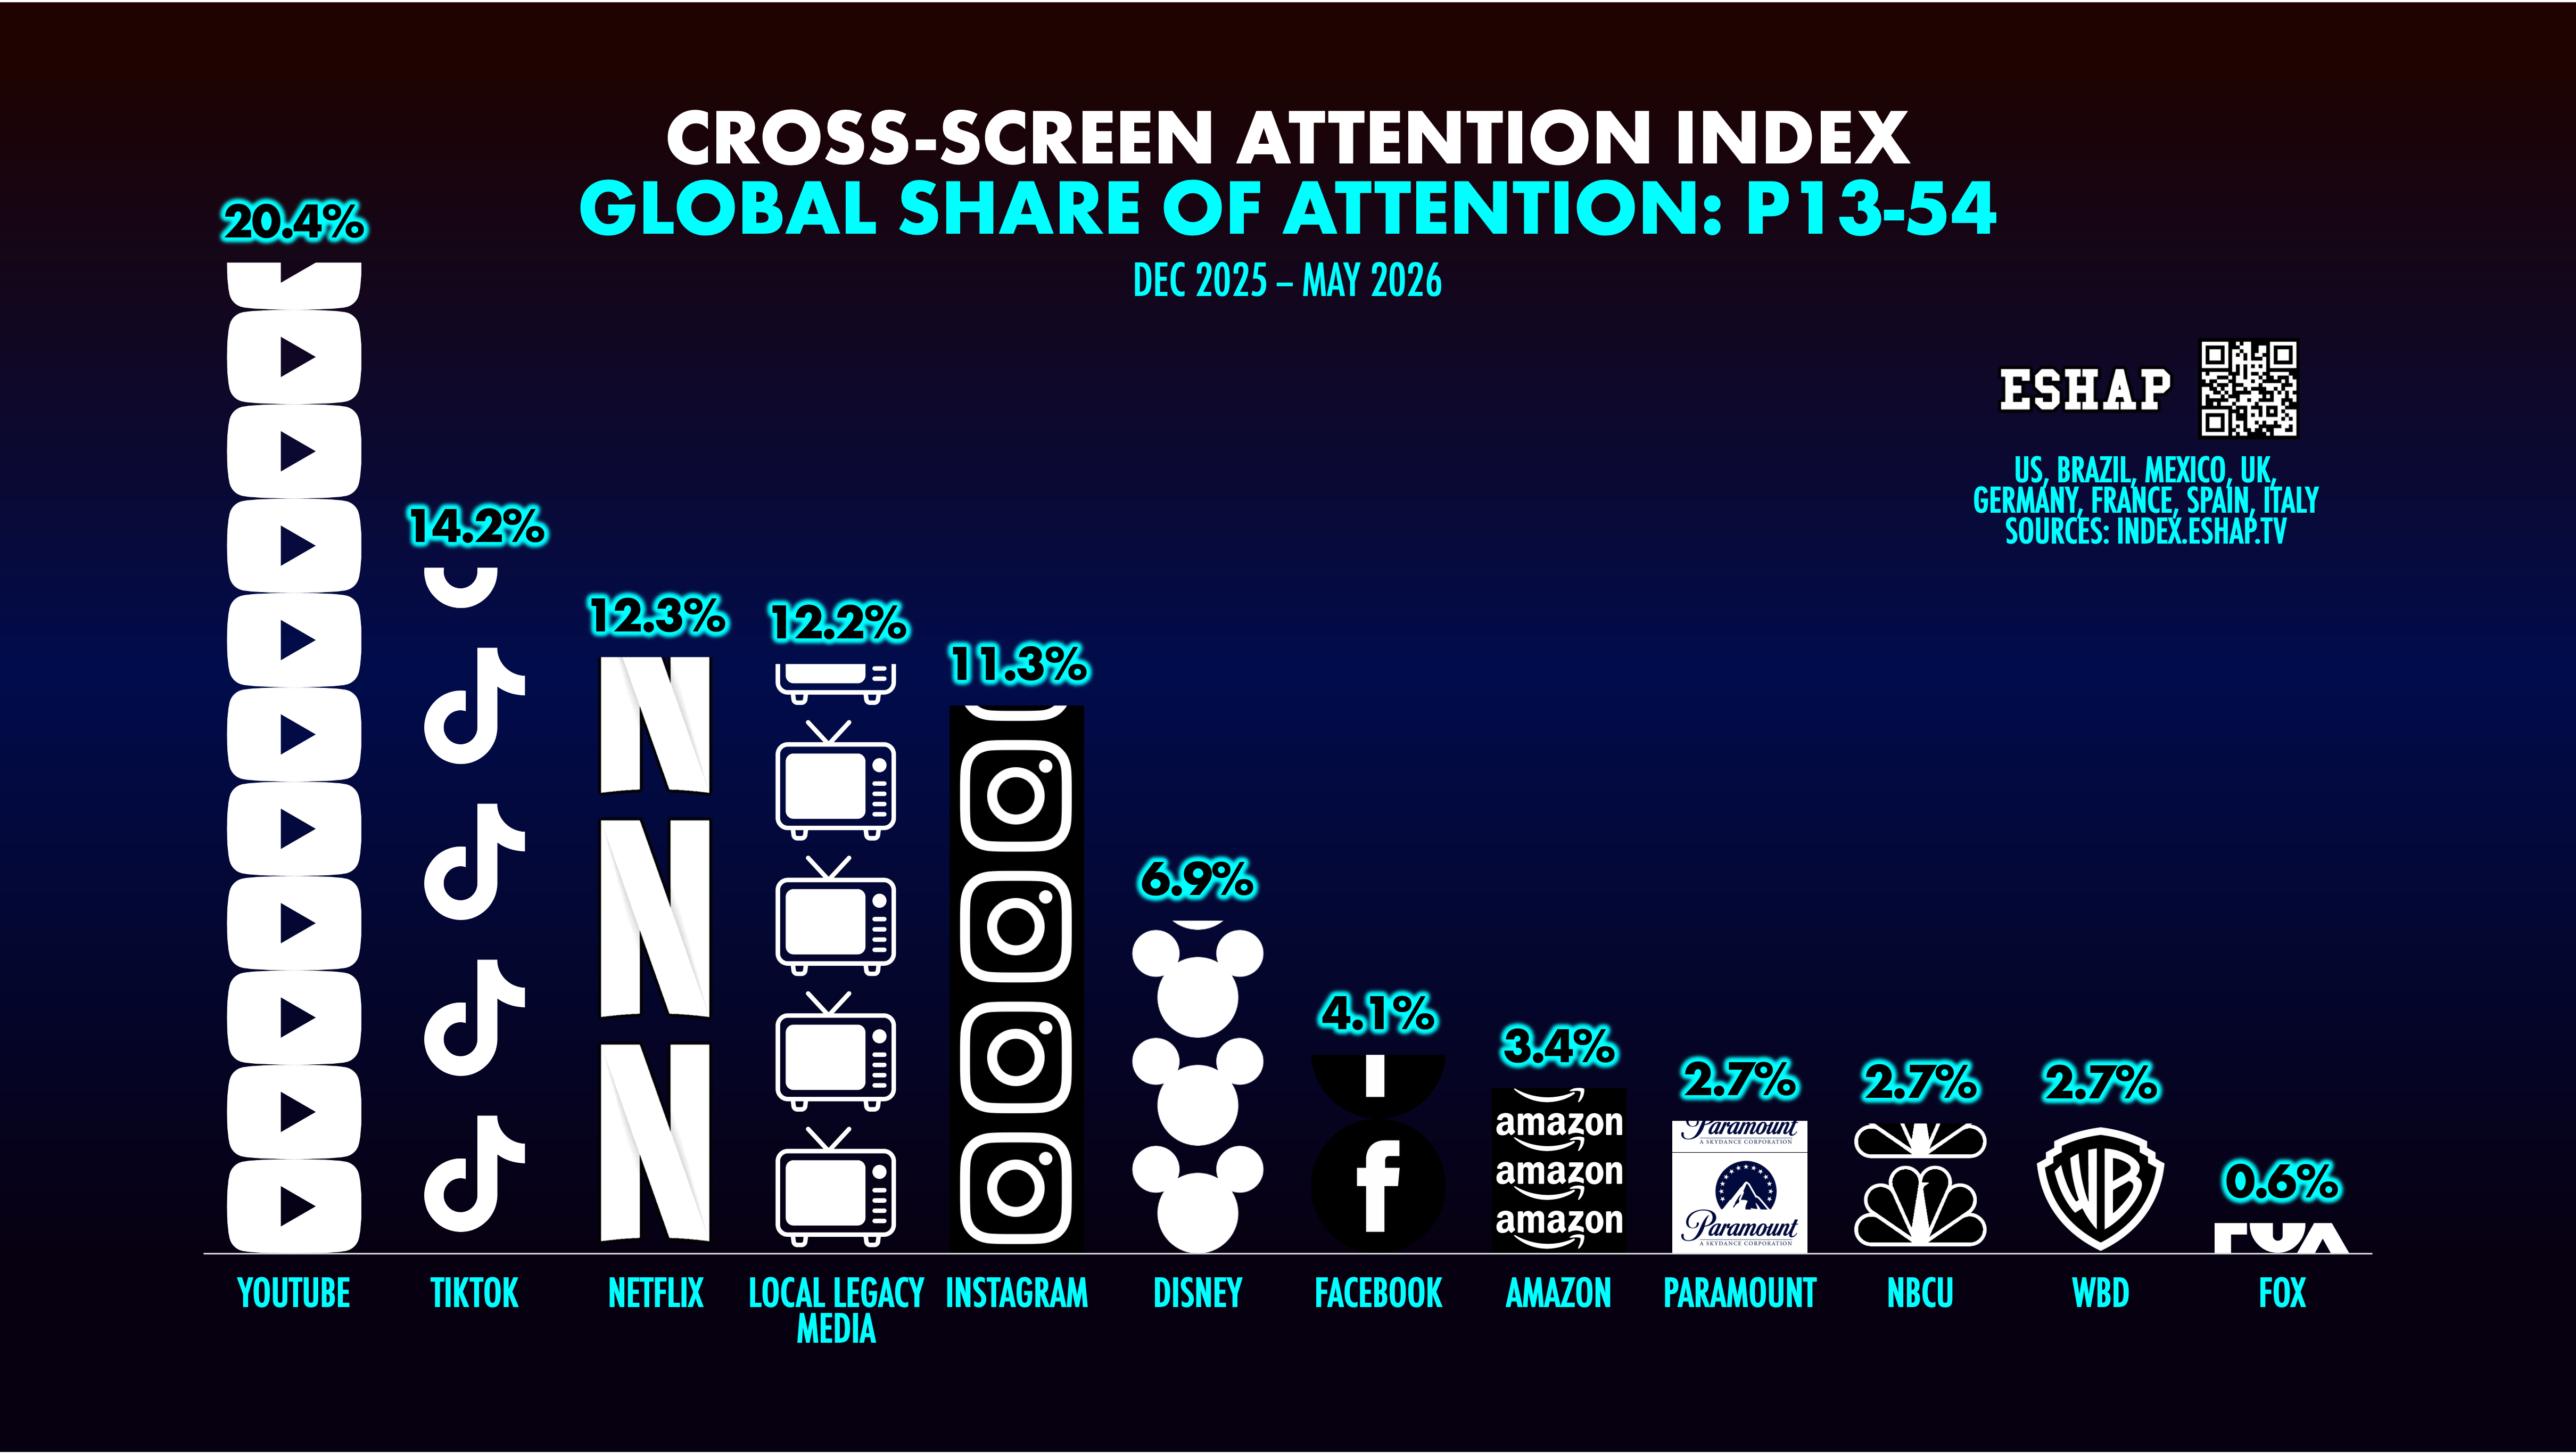
Of all the data in this report, perhaps the most pivotal is this: 82% of the world population — 73% of the people in these eight regions — are now 54 or younger.
This new index reveals that, across the planet, Legacy TV relies, almost entirely, on a shrinking minority of our most senior citizens, watching the same stuff, over and over and over, throwing off the balance of our measured video consumption.
When you remove that dying demographic (of which I am, myself, solidly a member), the combined fourteen Legacy outlets in this index are surpassed — handily — by YouTube, Netflix, and TikTok.
Even more eye-opening: Across these countries, YouTube garners more attention among people 13-54 than Disney, Disco Bros, Paramount, NBCU, and FOX — combined. And TikTok beats all other platforms except YouTube for attention paid, including Netflix, and Local Legacy Media.
But a zoomed-out, global view is not truly actionable, nor the point of this new index.
Rather, our intent with this new, free, interactive, user-driven platform, is to provide a strategic fiscal and investment planning compass for each of these regions.
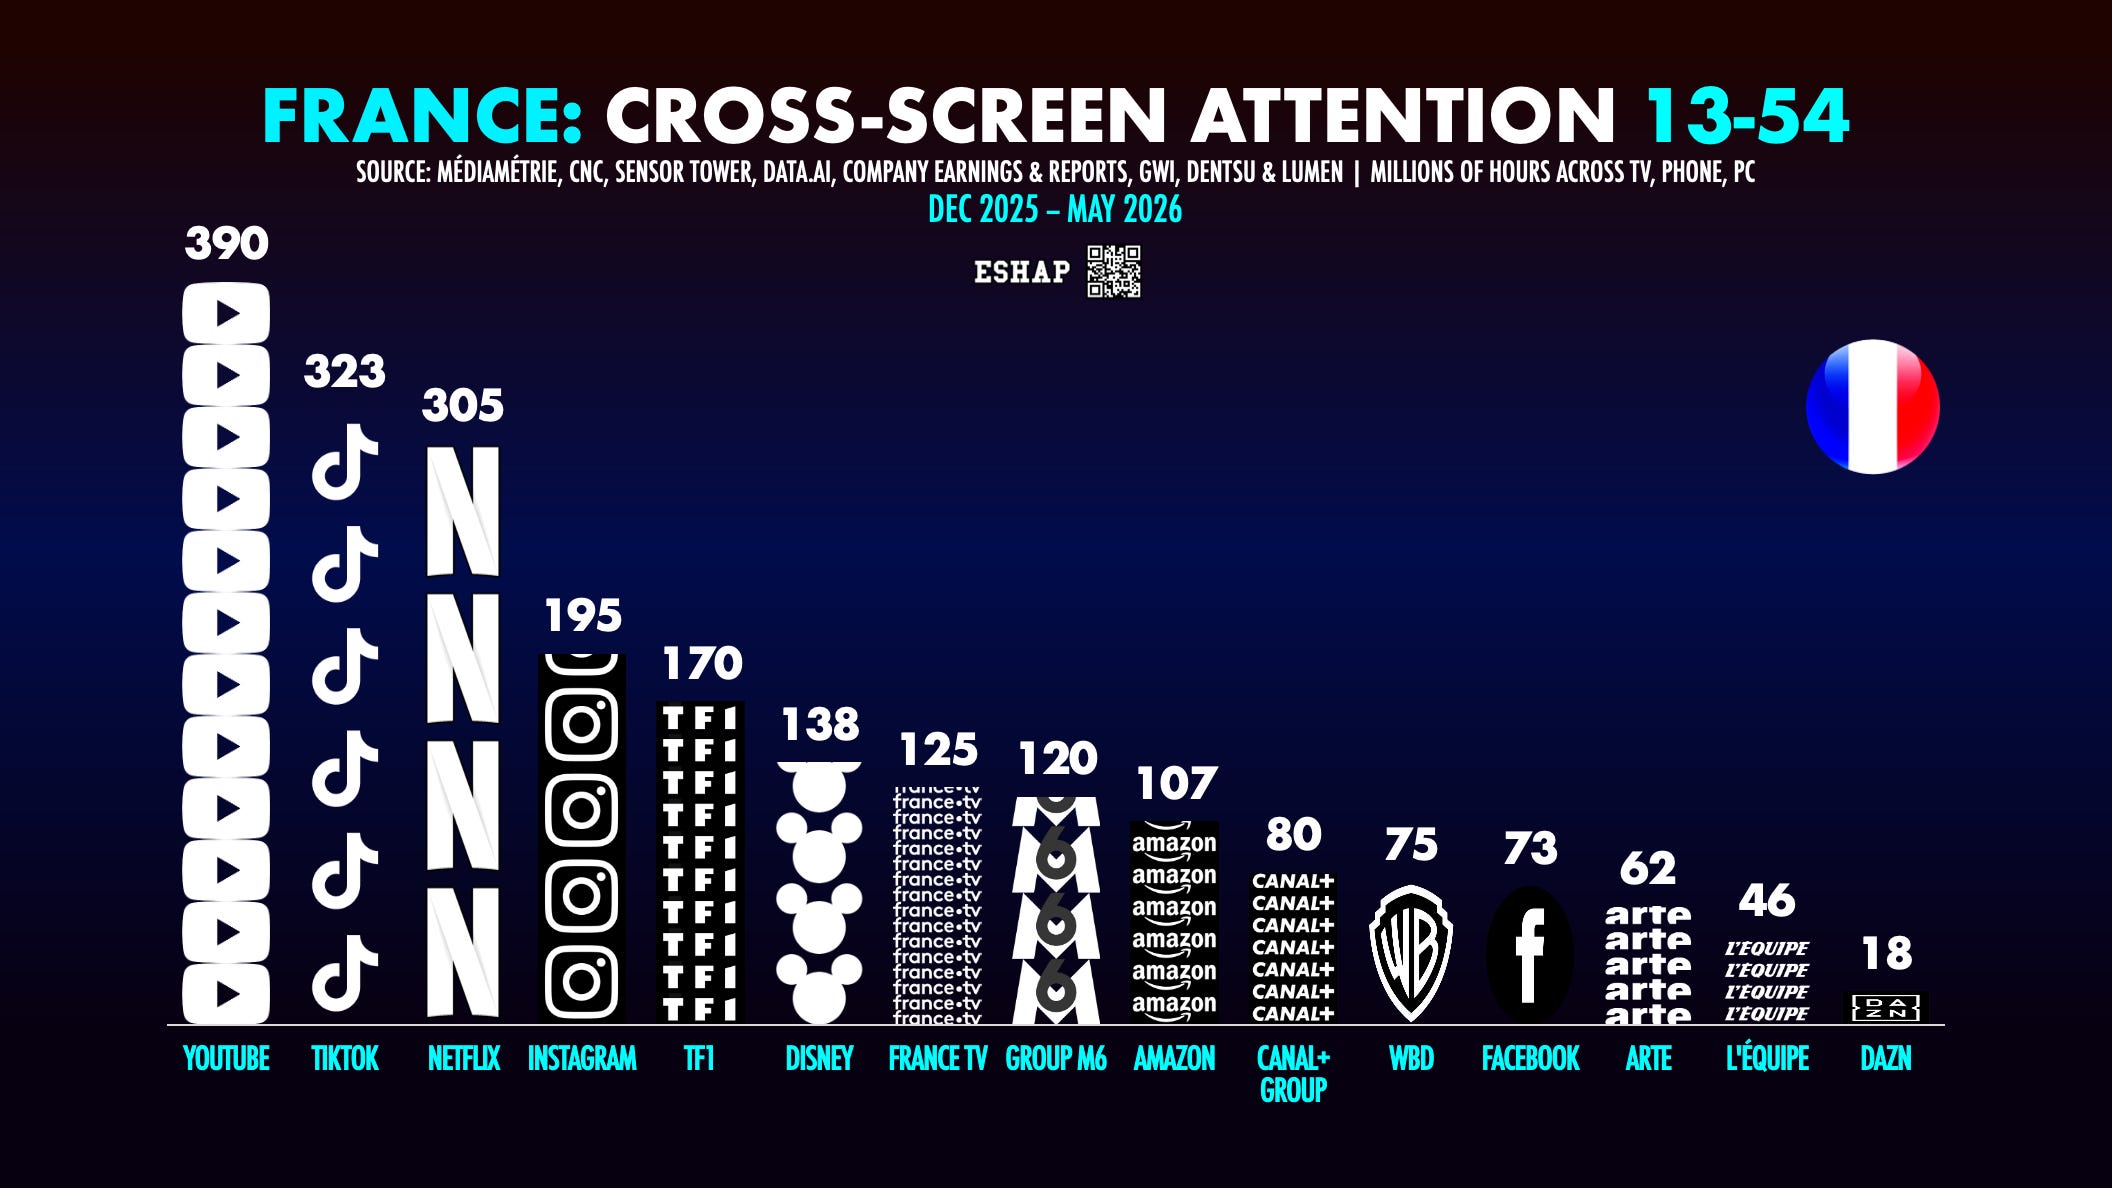
The ESHAP CROSS-SCREEN ATTENTION INDEX (ECSAI) is now live — with data for total cross-device attention, for France, Brazil, Mexico, UK, Germany, Italy, Spain, and the US, from December 2025 through May 2026.
It is the first zero-sum, wholly-deduplicated map of human attention in history.
It shows the total hours of attention paid to each platform, side-by-side, accounting for daily human attention as a finite resource, which cannot be divided between screens. In this index, if someone is looking at a TV, even if they have a phone in their hand, the time is allocated to the television. But, if someone is scrolling TikTok, even if the TV is on in the room, we apportion that attention exclusively to the phone, while discounting the TV that’s not being watched.
The data in The Index tells a remarkable story — a crime thriller, really — about the current state of global Media. See the chalk outline for yourself!
While Trad Media continues to cling to an aging audience, in ALL EIGHT MAJOR REGIONS — even where Legacy Media is deeply entrenched in the free Media culture and protected by local regulations — among the 13-54 majority, YouTube is the most used platform, by a sizable margin. Netflix plays bigly across all eight regions, but among 13-54 and all the younger demos, especially with Millennials, Gen Z, and Gen A, in most of these areas, TikTok outpaces Netflix, and all other comers.
In fact, as this new data shows for the first time, in many regions — particularly in the US — while YouTube is tops for total attention, TikTok actually beats YouTube among Gen Z and Gen A (consumers 13-34).
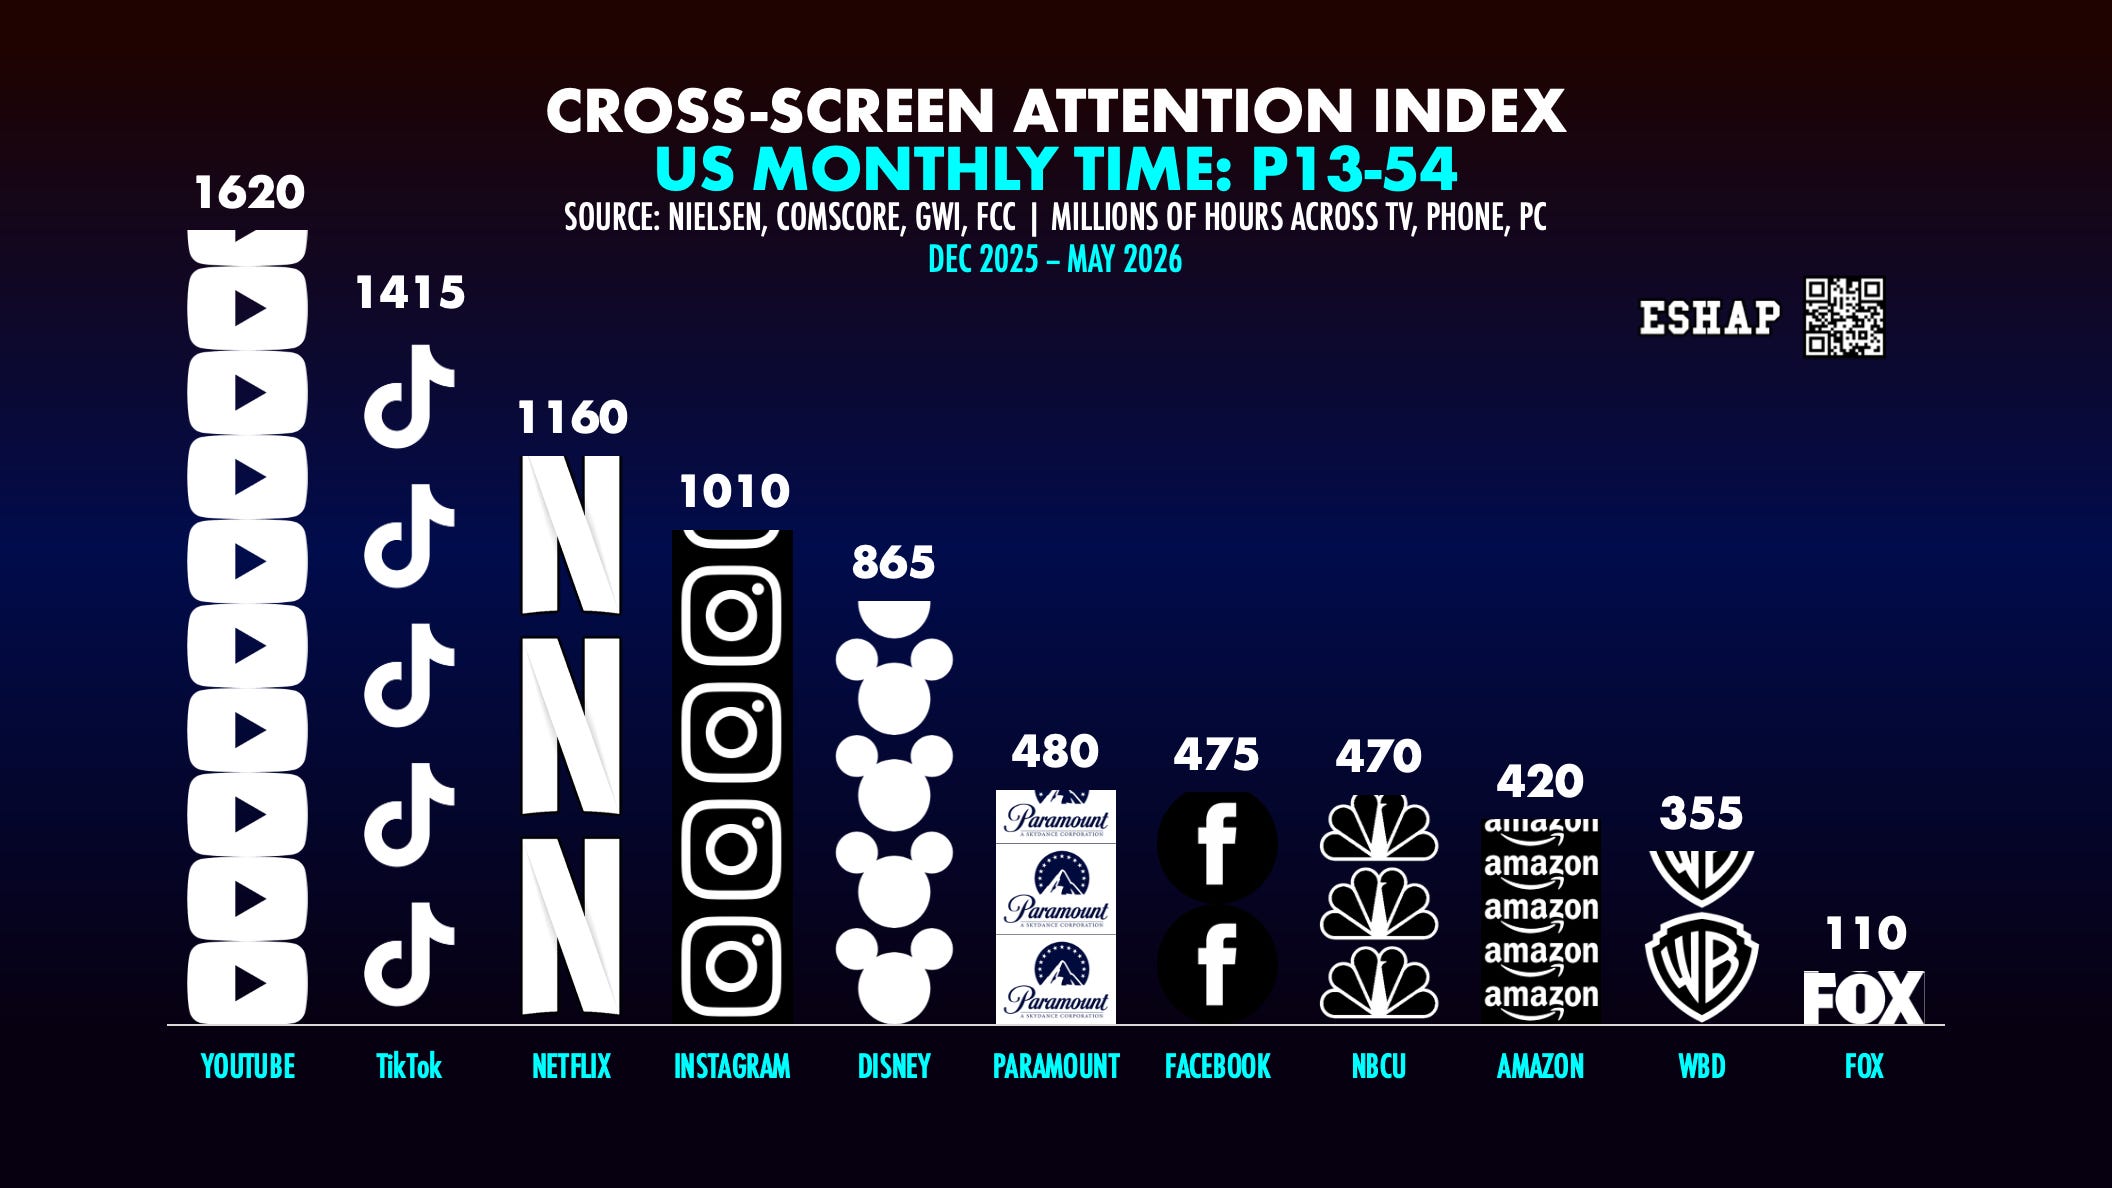
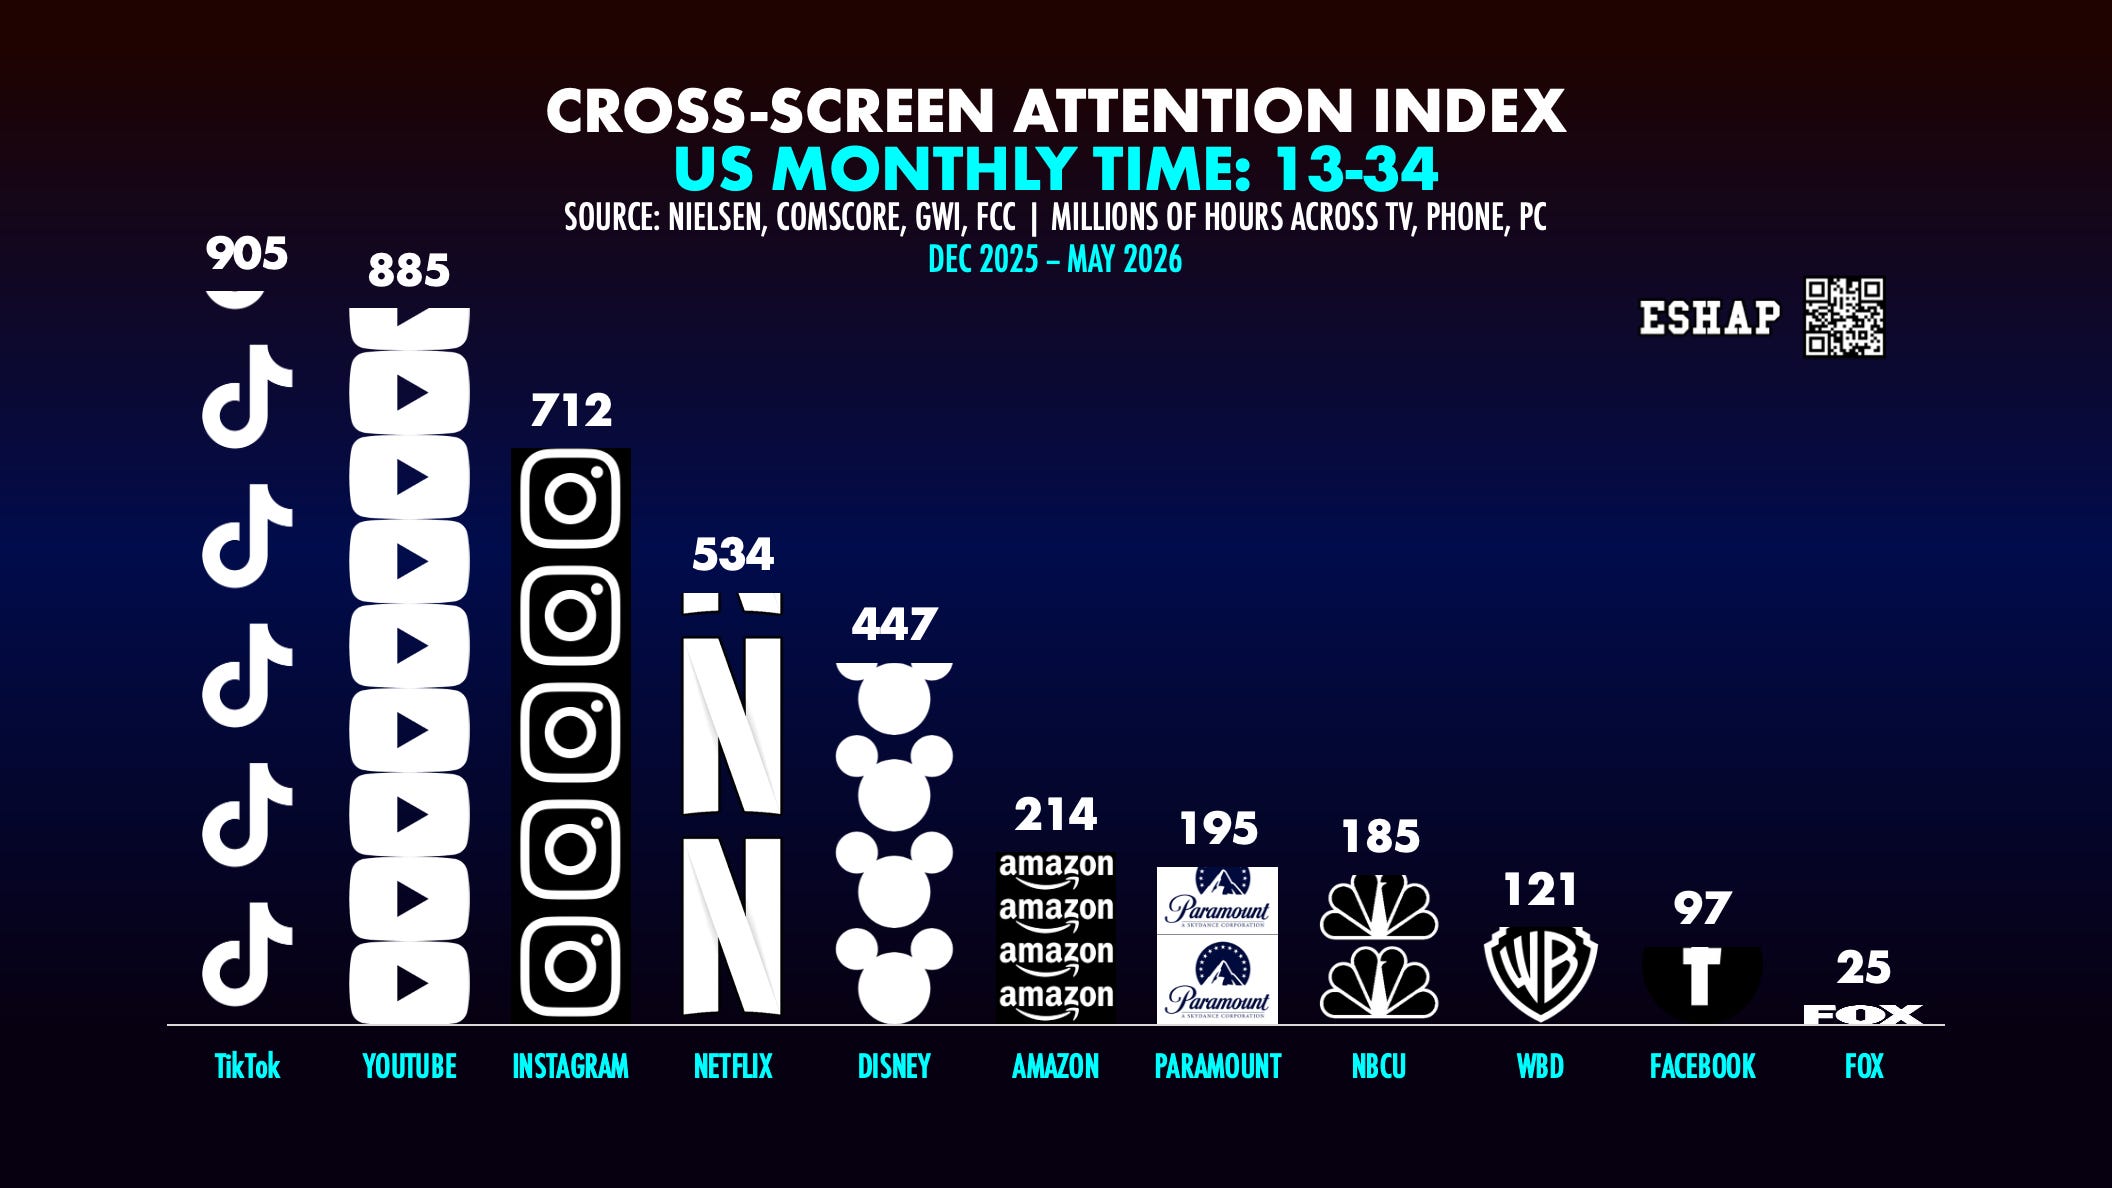
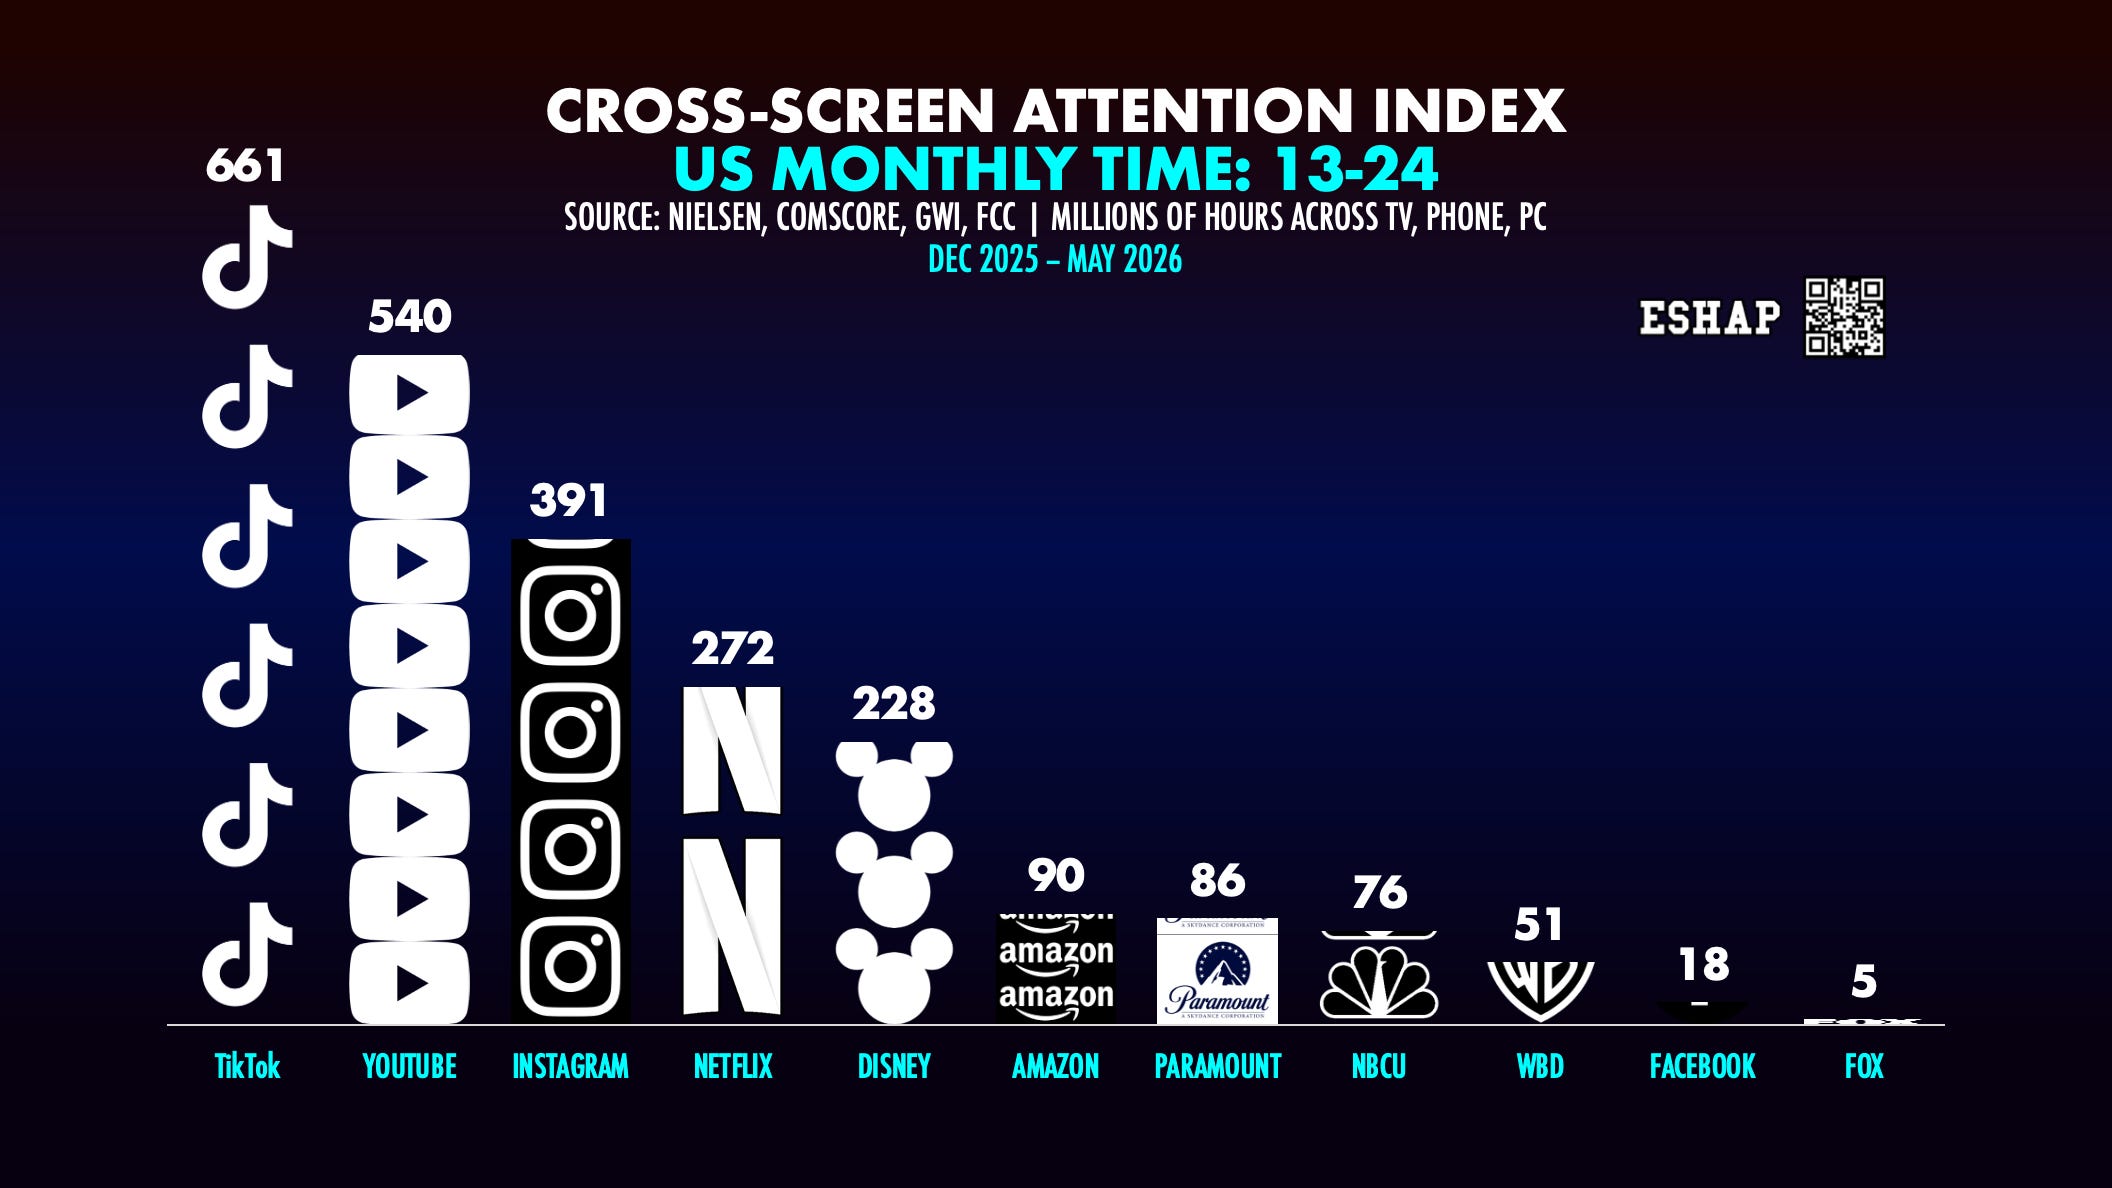
And this, ☝️ right here, is precisely why we need a Cross-Screen Index.
No one else is measuring all these platforms, side by side, across all devices. As a result, the industry gets easily distracted by feckless signposts that tells us “YouTube is #1* on TV!” (*with P2+ and without counting phones, laptops, or tablets).
Traditional Media currencies only track specific, individual devices, but not the humans who use them. They count a television playing to a room (whether full or empty) as an absolute premium, while viewing high-intensity, mobile consumption, with active thumb-and-eye engagement, as "digital background."
This collective industry blindspot is precisely why Trad Media drove into a brick wall. Legacy tracking systems want you to look at Media through isolated silos — weighting a television playing to no one as more equal than rabid attention paid to a phone.
A hyper-disproportionate amount of our Media measurement investment is spent measuring television viewing — even when that TV is not being watched. Thus, Media execs spend an equally disproportionate amount of time, energy, and resources fighting for control of a screen that only captures 40% of video consumption. That’s not just bad business; it’s a suicide mission.
The Index is designed to prevent that — it is designed to show, specifically, where the entirety of consumer attention is actually being paid, so that Media professionals can invest in content, advertising, overhead, and infrastructure, accordingly.
To achieve this, the ESCAI incorporates a Sovereign Boundary Model: with hard, quantitative ceilings locked down entirely by local, currency-grade telemetry logs (Nielsen, BARB, Médiamétrie, Comscore, Sensor Tower, etc.). Rather than asking consumers to estimate their viewing hours, the index uses this codified telemetry to establish absolute macro volumes.
Behavioral data from GWI Consumer Diaries is introduced strictly as a coefficient matrix to map friction points and calculate the mathematical overlap when two devices are running in the same room.
Three quarters of consumers actively use smartphones while the TV is on in front of them. Yet legacy currencies rely on passive boxes in empty rooms — counting televisions playing to heads buried in phones as “active viewers.” Instead, we use behavioral data to verify actual human presence and device co-activity. By injecting human reality back into blind hardware metrics, The ESCAI enforces the absolute laws of human physics and accounts for time as a non-elastic, zero-sum commodity — a closed market sponge.

SEE: ESHAP CROSS-SCREEN ATTENTION INDEX METHODOLOGY & SOURCING.
Each quarter, we will update the ECSAI (pronounced EE-say) with new data, on a rolling six months basis. Simultaneously, we will drop an Index Report, with deep analysis of the data and the trends, right here on Substack.
This is different from other measurement offerings, which provide small, irrelevant glimpses of data for free, then charge clients millions of dollars per year to fund it — while keeping the vast majority of us who work in Media in the dark. This incentivizes the measurement industrial complex to lock our data in silos, dividing and double-counting consumer attention.
Below you’ll find my first-ever ESHAP Cross-Screen Attention Index Report, with a deep dive into all the data from all eight regions.
HERE ARE THE RED HOT TAKES FROM THE FIRST ESCAI REPORT:
While Local & Global Traditional Media in all eight countries continue to draw attention from local consumers, their businesses have become senior living societies — disproportionately dependent on the shrinking minority of their populations over the age of 55.
For the supermajority of audiences in all eight regions (people 54 and younger), YouTube now dominates our collective attention.
However, TikTok is coming on, fast. In the US and many other regions, TikTok is now #2 with consumers under 55 for total attention paid each month, #1 with consumers under 35, and actively threatening YouTube’s attention title with all consumers under 45.
Netflix is strong in many of these regions. Yet, they appear vulnerable to phone consumption around the world.
Netflix loses to YouTube in every region. More urgently, they are now behind TikTok for total cross-screen attention with consumers 13-54 in the US, the UK, Brazil, Mexico, Germany, France, Italy, and Spain.
For audiences 13-44 Netflix loses the battle for attention to Instagram in five of the eight regions: Brazil, Mexico, Spain, Italy, and the United States.
When we collapse Facebook and Instagram into a de-duplicated Meta metric, Meta sweeps Netflix in all eight regions for users 54 and younger.
On the interactive Cross-Screen Index, we allow you to toggle the data to combine or separate IG and FB into one metric for Meta. However, we measure Instagram and Facebook separately in this report, as they have dramatically different user-bases.
53% of Facebook’s user-base in these eight countries is over 55, whereas 90% of Instagram’s audience is 54 or younger.
YouTube still beats Meta in all these regions among consumers 13-54, but not by much.
Global Trad Media in The Index — Disney, Fox, Disco Bros, Paramount, NBCU — play differently in various regions, but their total lack of cross-screen strategy has them losing badly to Global Big Tech platforms in all eight territories.
All of the Trad US Media giants fail to secure even one #1 or #2 spot among people 13-54 in any of the eight regions that we cover — including their home territory.
When we embark on projects like this, we start fresh. No preconceptions. No confirmation bias. We let the data give us the plot, then we tell the story. This is, by far, our most ambitious data endeavor yet. It’s a Mt. Everest of data, and it tells a remarkable story about the future of Media, based only on the actual needs of real consumers.
We will keep following the data where it leads us. And The Index will always be totally free. For my Index Report, you will need to upgrade to Premium Peacenik (aka paying subscriber). This helps us fund the work behind The Index, while keeping it free for everyone.

CROSS-SCREEN ATTENTION INDEX REPORT: JULY 2026
Keep reading with a 7-day free trial
Subscribe to Media War & Peace to keep reading this post and get 7 days of free access to the full post archives.