

CROSS-SCREEN ATTENTION INDEX: THE FIRST MEASUREMENT OF THE WHOLE VIEWER
Introducing a first-of-its-kind, logic-enforced map of human time across every screen.

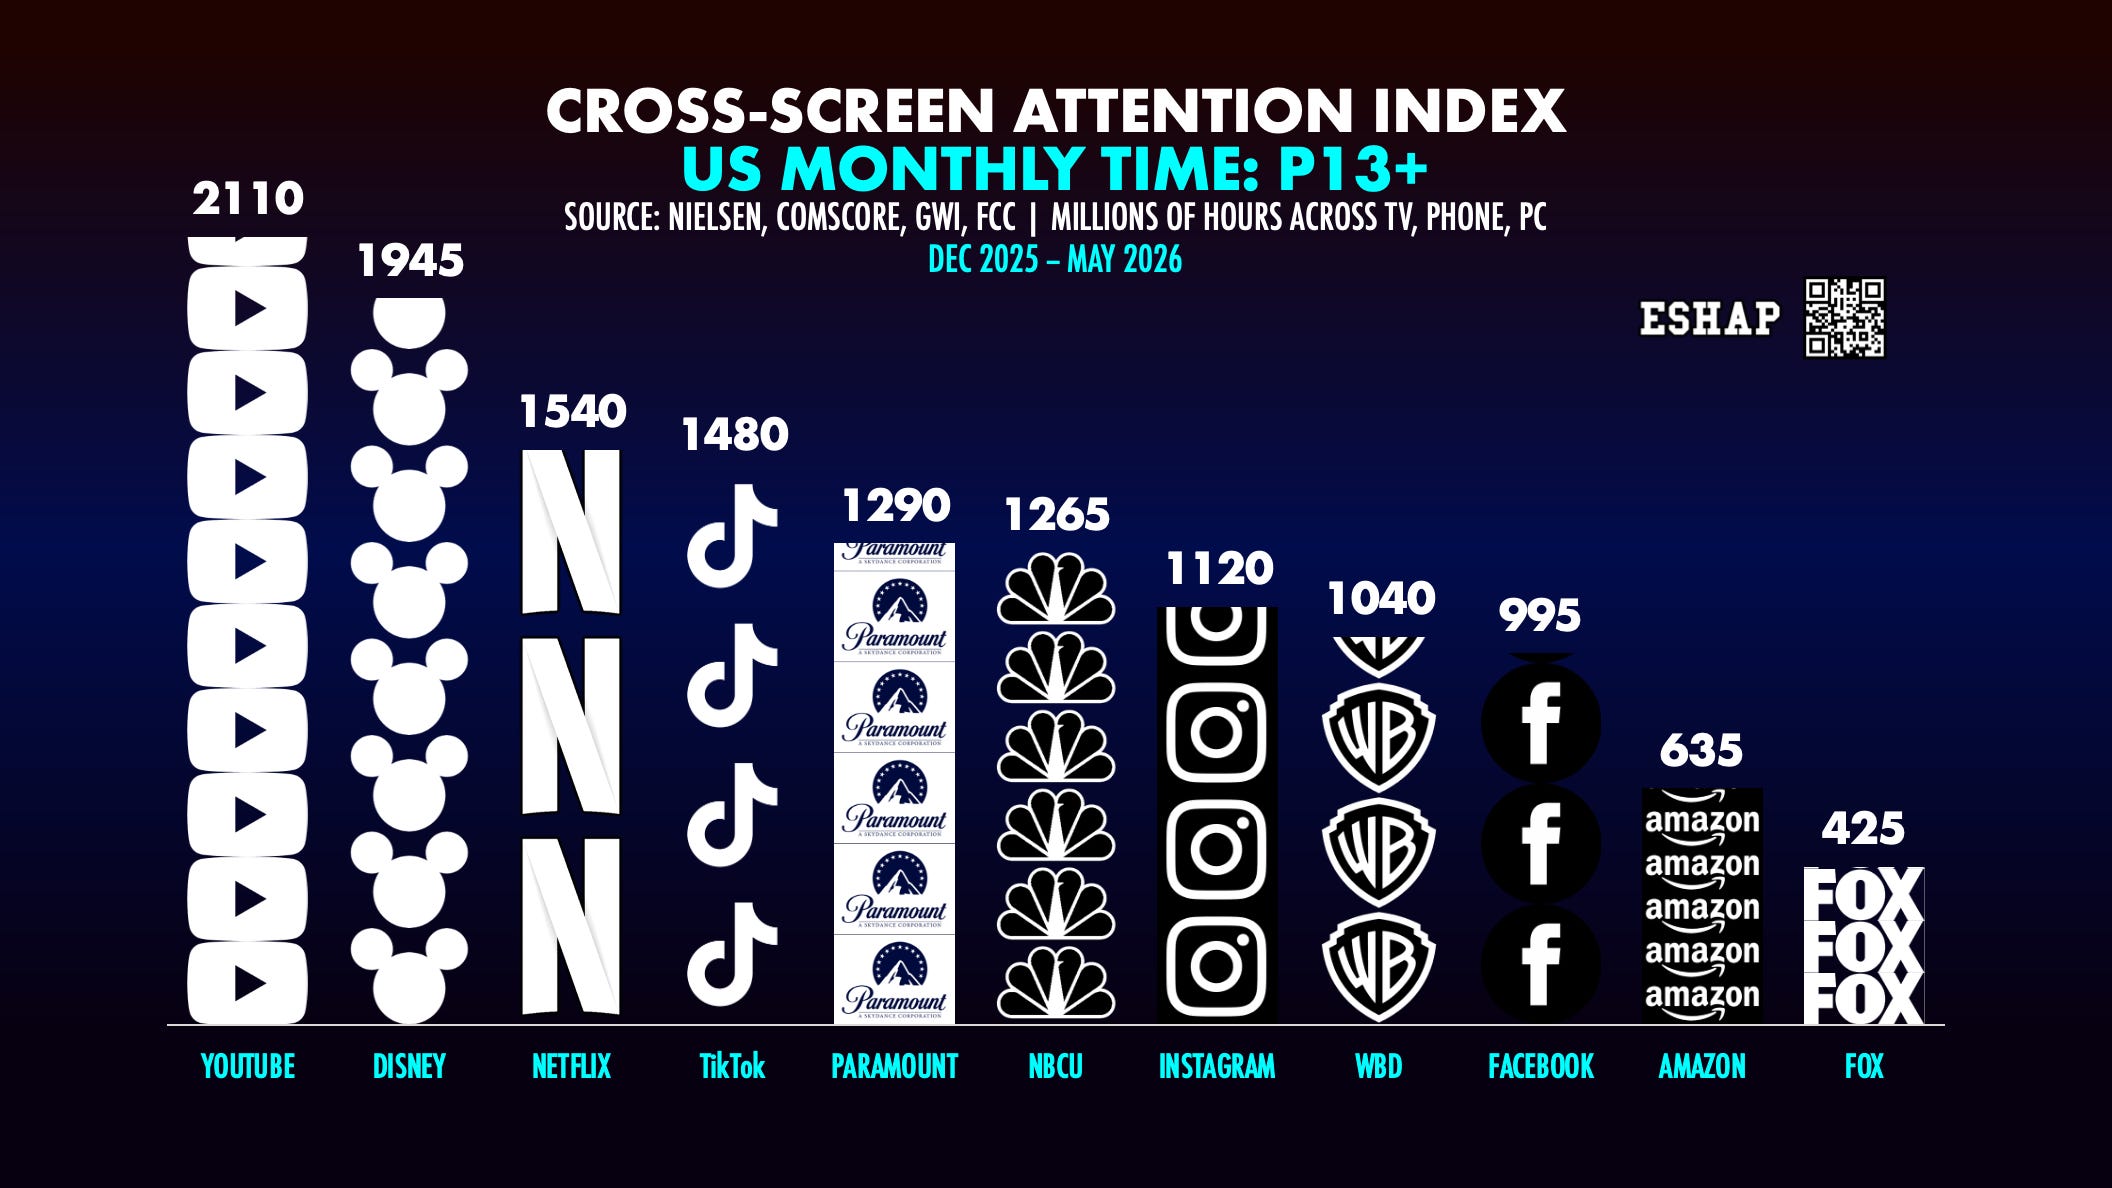
Happy Monday Peaceniks. Let’s get right to it: Today I am unveiling a new, first-of-its-kind index of consumer time and attention across all screens — the first time anyone has attempted to compare time spent on major US media platforms across TVs, phones, and personal computers.
Introducing the ESHAP Cross-Screen Attention Index.
In the commercial Media industry, measurement has always been divided by screens. No major auditing bureau or currency panel has ever forced television meters, handset timestamps, and browser logs into a singular, logic-enforced, zero-sum attention budget. This is collective malpractice. If you still treat social video and television as separate silos, to twist the age-old Wanamaker adage: You are wasting half your fucking money.
Here’s why…
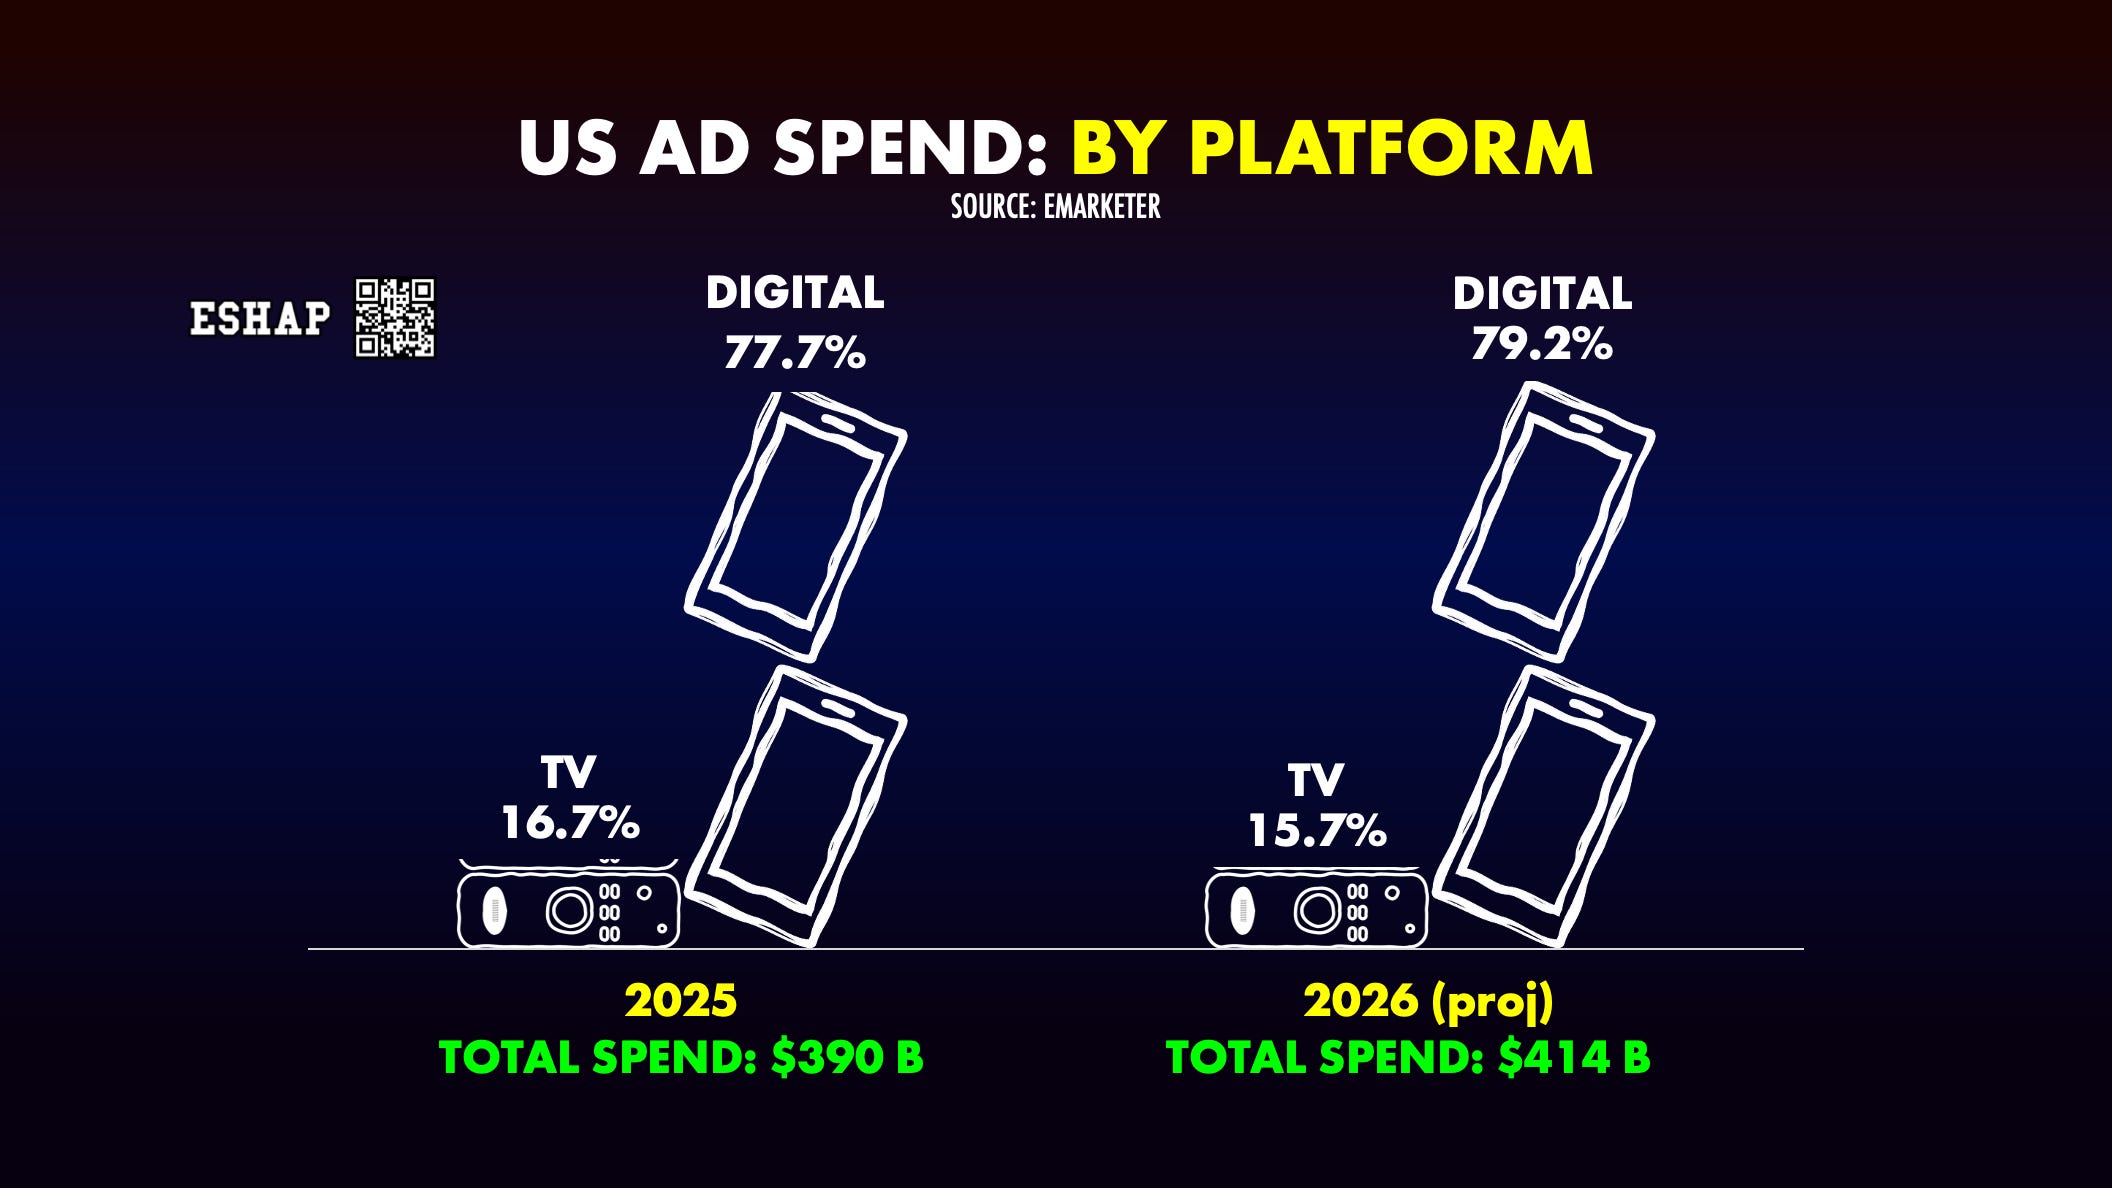
In the next three years, one trillion dollars will be spent on advertising in the US. More than three quarters of that will be spent on digital platforms. Another $180 billion will be spent on television advertising. No one is measuring the reach, frequency, or effectiveness of this massive cashflow across these platforms.
Publishers and advertisers look at their TV ratings, digital buyers and social media experts look at mobile handset logs, and everybody claims they are winning the war for reach. Meanwhile the measurement industry locks agencies into long-term contracts, then charges sellers through the nose to use their “currency.” Or, they will track attention across all the platforms, but only by campaign - not as a map nor trajectory of total cross-screen attention. This leaves our collective data on real attention siloed to the point of pointlessness.
The industry is totally blind to how real people actually behave. Today’s consumer is a singular, fluid entity moving seamlessly across a multi-screen day, allocating a single, finite commodity: attention.
The Media industry is lost specifically because they are charting their course based on the failed logic of vanity metrics, rather than following the actual data; the voice of the audience.
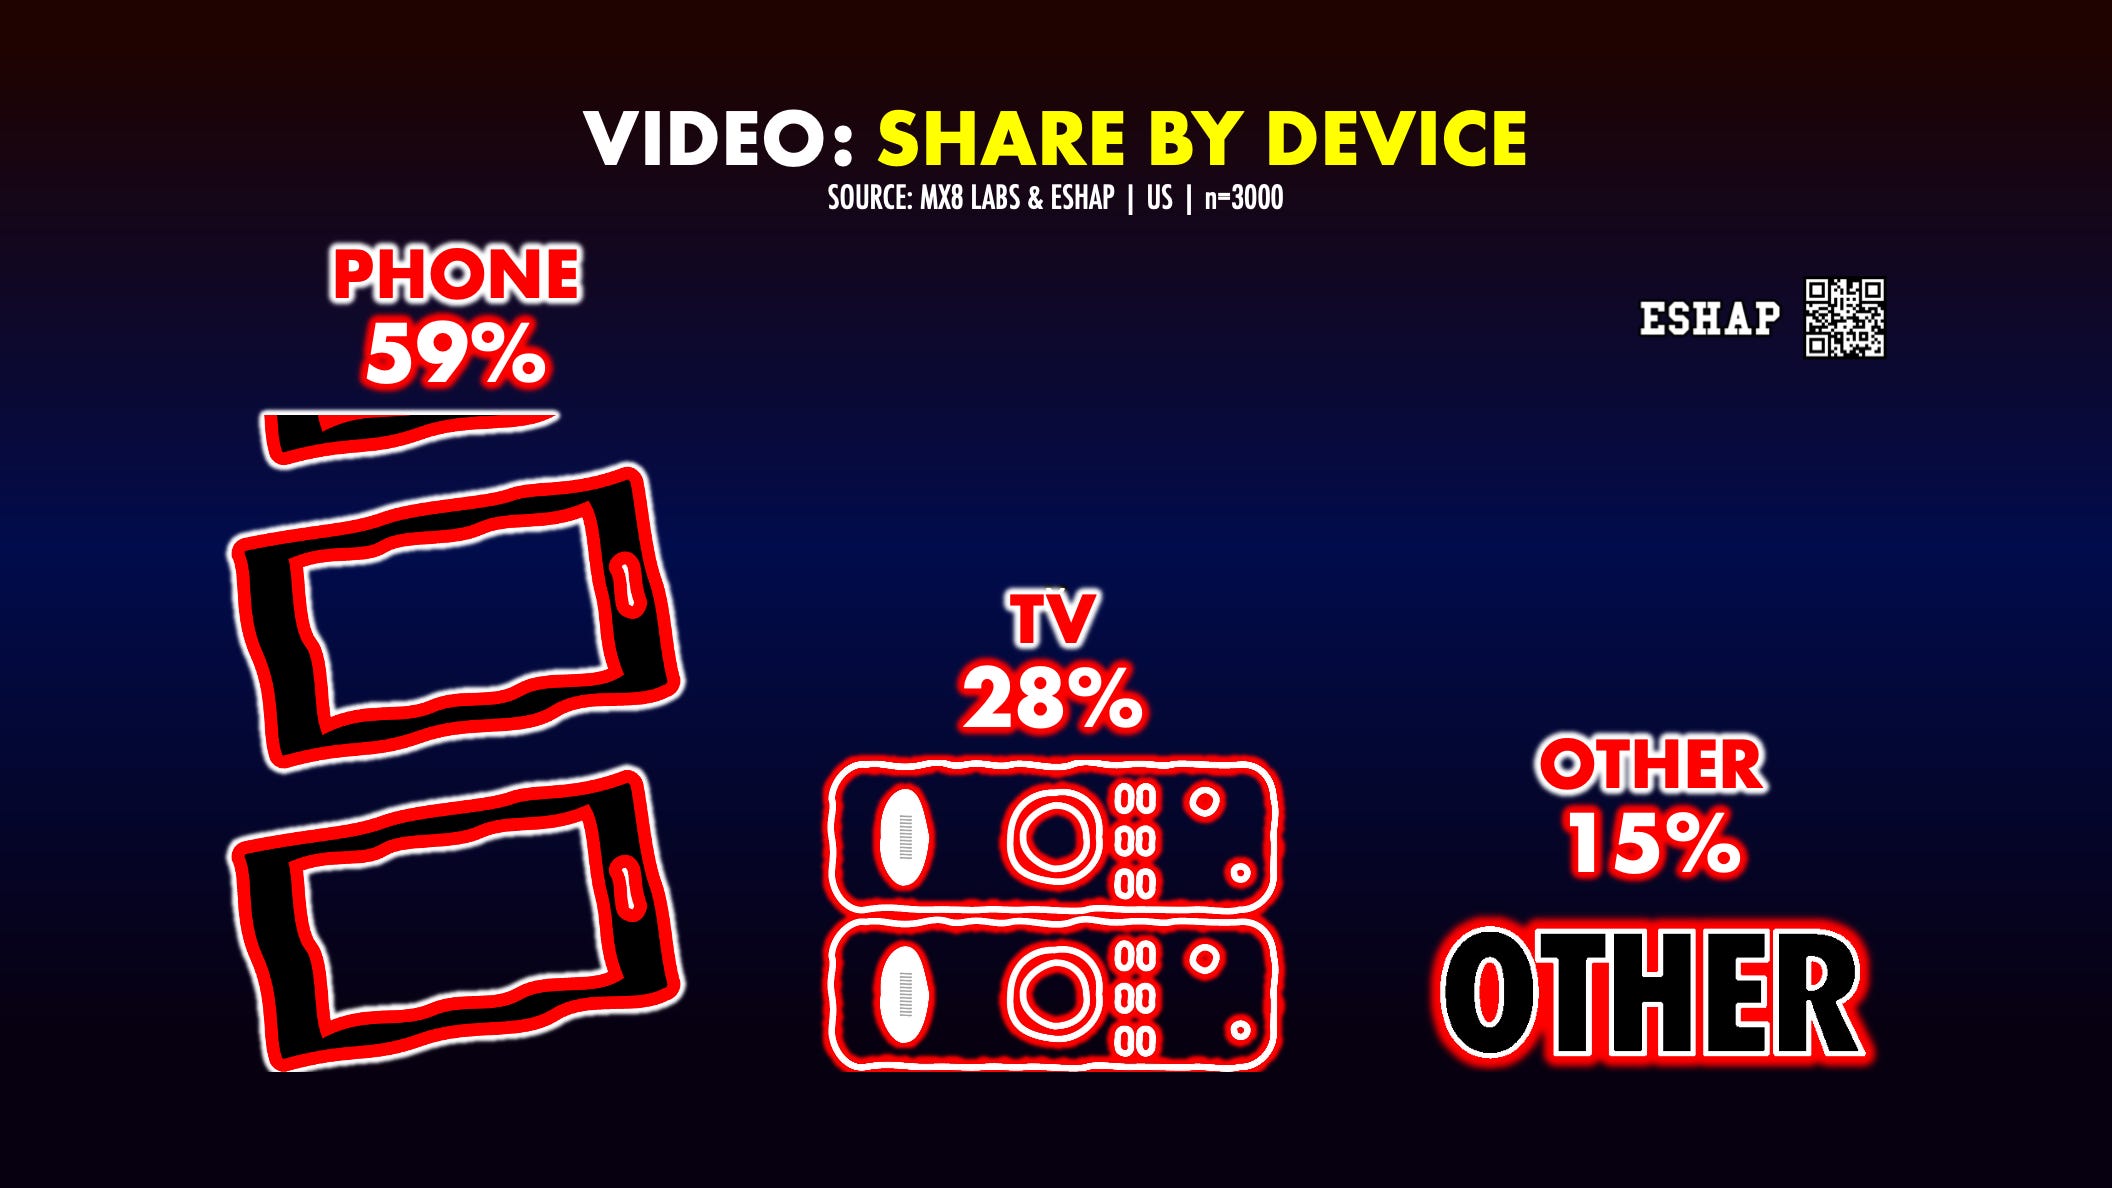
In a recent survey by ESHAP and MX8 of 3,000 US consumers, 59% of people say they use their phone to watch video more than any other device. Just 28% named TV as their most-used source for video. When you look only at people under 55, however, this ratio gets more dramatic.
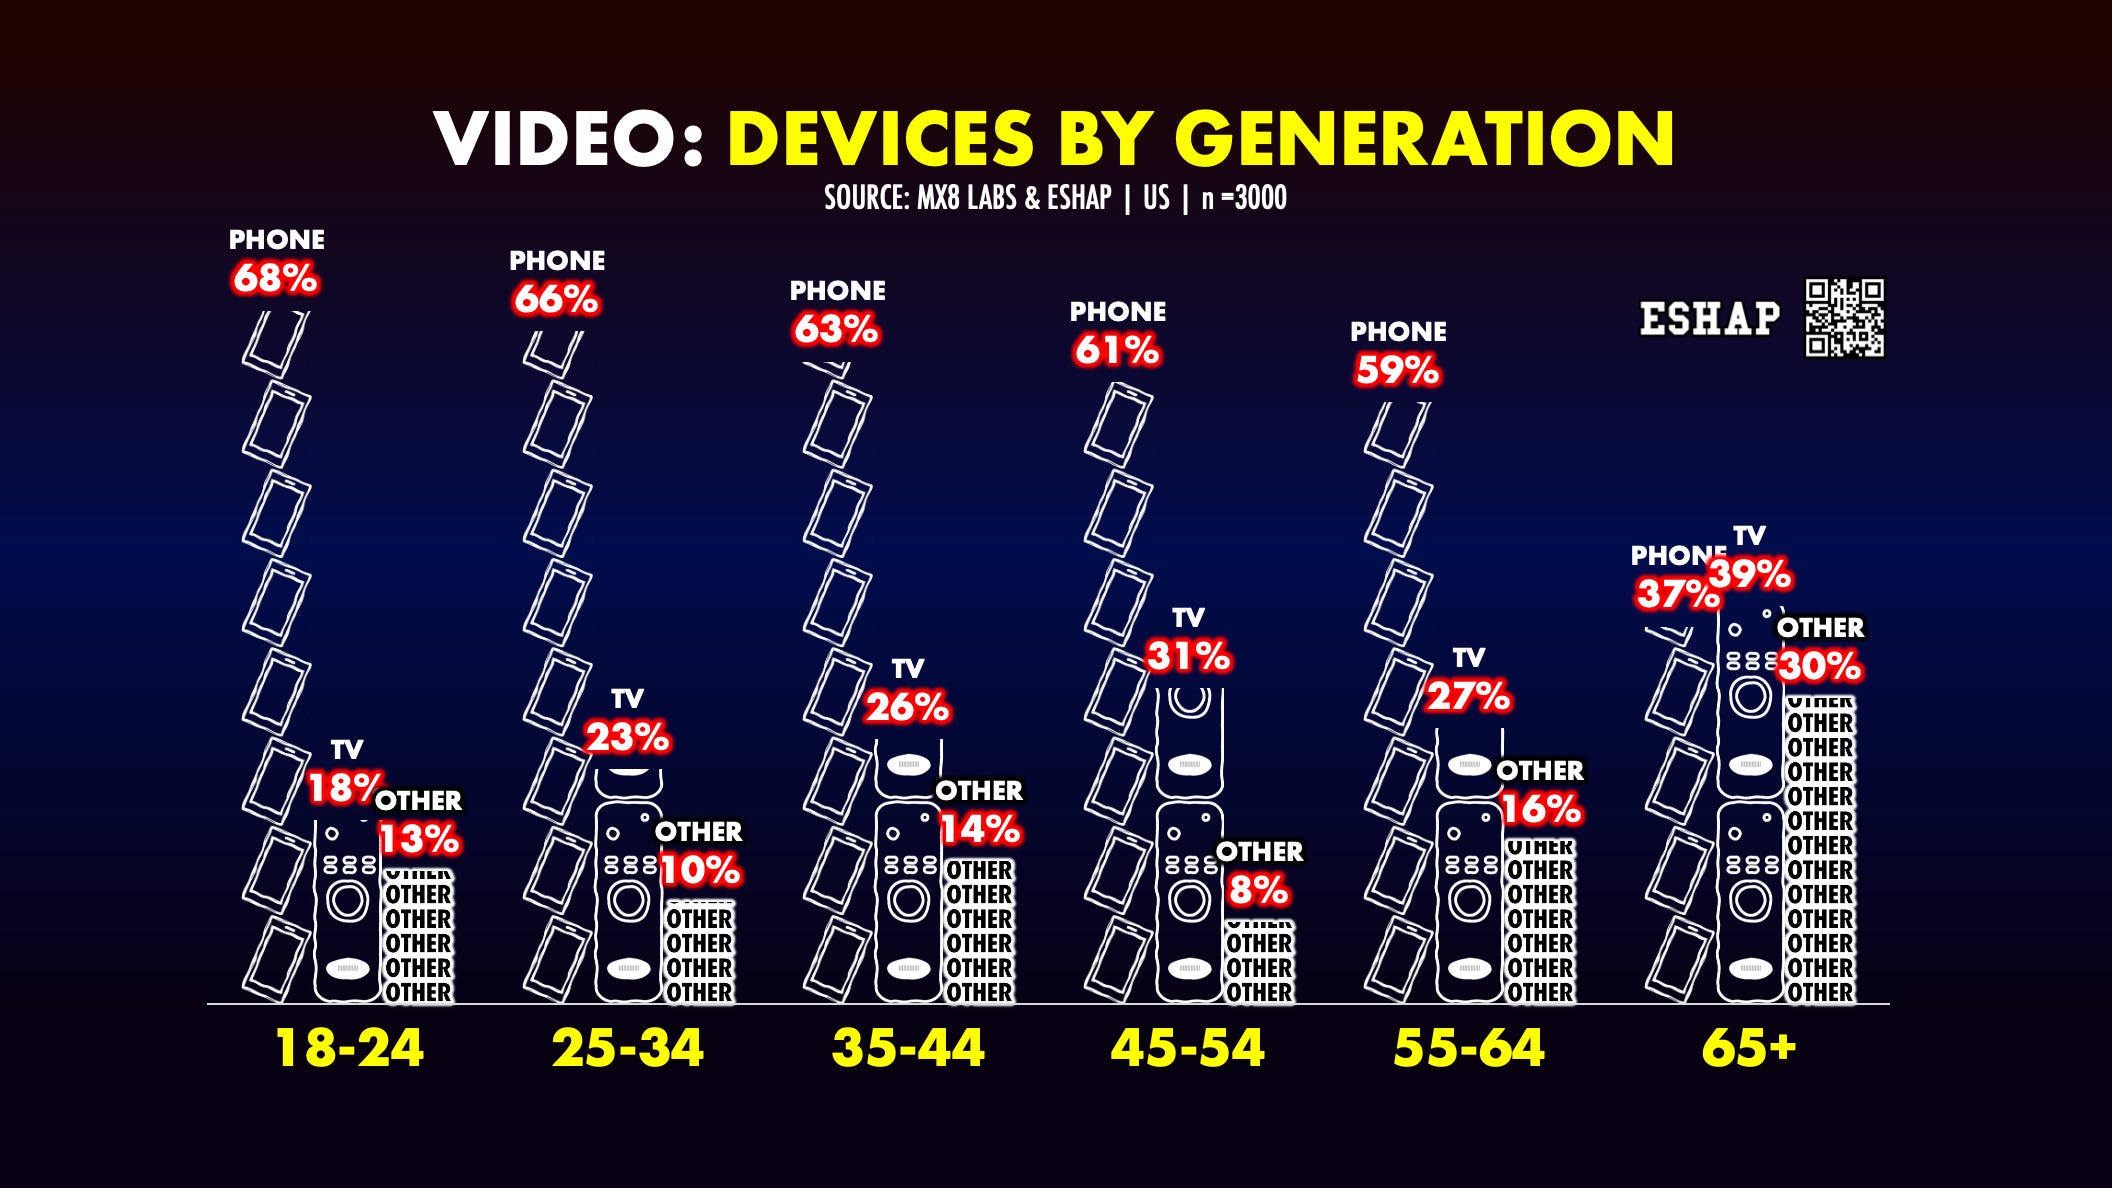
Only Baby Boomers watch more video on televisions than on phones. Every other generation of Americans watches video on their phones two to three times more than their TVs.
This is the Media Generation Gap.
I have been studying this trend all year. I have become obsessed with the idea of measuring total attention among competing platforms across all screens.
As far as I can tell, the ESHAP Cross-Screen Attention Index represents something never achieved in media analytics: a singular, logic-enforced, zero-sum attention budget that tracks the whole consumer across all attention endpoints simultaneously.
By treating human focus as a tangible physical property constrained by a fixed 24-hour clock, we built a model that removes corporate bias, complacency, and corruption from measurement.
This model produces a singular, unduplicated map of total human attention by harmonizing Nielsen’s TV currency with Comscore’s handset panels and GWI daily consumer diaries. We collapsed every delivery mechanism — linear, on demand, broadcast, cable, subscription streaming, free ad-supported streaming, and mobile social feeds — into their corporate parents. To do this, we built a deterministic Python accounting engine that operates under the laws of data science and geometry. This logic engine treats attention as a closed, zero-sum matrix.
This data is from December 2025 through May 2026, and tracks all attention, including time spent watching video and consuming other social media.
The results show, for the first time, a more accurate media hierarchy across every format and screen — from vertical social feeds and letterboxed streaming to smartphones, laptops, and Connected TVs. Is this Index a 110% perfect read of all Media usage? No. Does it provide a clearer, more accurate account of actual, total Media attention in the US than the industry has ever had? Hells to the yeah.
Our data construct is sound. But the framework for this index is not built solely on quantitative analysis. Over the last year, we have interviewed hundreds of experts, practitioners, vendors, buyers, managers, executives, interns, academics, data scientists, platforms, publishers, producers, and members of our community. On nearly every one of our working days.
The numbers in this index are from companies we all know. So is its point of view. We knew to ask the right questions, because everyone asked us. We use words in this report that come straight from the mouths of the people, at all levels, who run all the companies in the Media Universe.
These results are not mine. They are ours. These opinions aren’t mine. They are ours.
The underlying raw inputs we used to construct this index — Nielsen’s Media Distributor Gauge, U.S. Census population stats, Comscore’s digital market updates, and GWI’s consumer diaries — are all 100% publicly available, out in the open for anyone to read. Yet, no one in the multi-billion-dollar Media Industrial Complex has ever combined and shared them. Because our industry is kept in eat-what-you-kill silos. So we don’t ask.
That fear of finding out is the systemic blindness now pushing our industry off a cliff. Thus, the Cross-Screen Attention Index. It’s our new compass, away from the cliff and on the path toward today’s audience: The Whole Consumer.
Like many metrics used in the Media Universe, this index’s framework — our Cartographer’s Blueprint — is a mix of hard math and human behavior. We have a pretty strict methodology for both. The quantitative methodology is at the bottom of this report. The qualitative framework is our secret sauce, so, then, it’s secret.
The result, is that the ESHAP Cross-Screen Attention Index shows a picture of the Media landscape, and The Whole Consumer we have literally never seen:
Keep reading with a 7-day free trial
Subscribe to Media War & Peace to keep reading this post and get 7 days of free access to the full post archives.