


KNOW THE SCORE

Happy Monday War & Peaceniks. Ready to be measured?
I love sneaker collabs. My favorite right now is Wales Bonner x Adidas. They are 🔥, they are comfy af, and they have blue fur.

So, when Comscore approached me for a partnership on a new, monthly report about TV viewing, my first thought was: “It’s a measurement collab!” They were like “Ok Ev, if that makes you happy, sure.” It does.
Knowing which programs garner the most viewers is nice. But is it useful? At the end of the day, this is show business. The reason we measure audiences is so that we can monetize them. Right‽ Most reports on TV audiences these days offer various ways of looking at viewing totals, without discriminating between ad-supported and ad-free environments. Which makes the data wholly un-actionable.
Our new (collab) report is called The Score.
Rather than yet another bland dispatch on what’s getting watched, without any actionable insight, we decided to create an ongoing account on what matters most to the collective TV community - where the monetizable eyeballs are - specifically what share of the viewing has (wait for it) ad inventory. I like to call it share of ad TV voice.
The Score employs Comscore’s BIG DATA: A combo of Comscore TV, Connected TV Intelligence, and Smart TV information, from 22 million US households. This allows us to generate a unified view of TV ad exposure, across Pay TV, Broadcast, and Streaming, nationally and at the market level. Importantly, this free monthly report will offer everyone a first-ever apples-to-apples comparison for SHARE OF AD-SUPPORTED VIEWING. So much of the current conversation around CTV viewing is shrouded in a fog of confusing data. This collab counts the data that counts.
The first full report drops next month, just in time for Advertising Week NYC. BUT… today, War & Peaceniks, you get a special sneak peek!
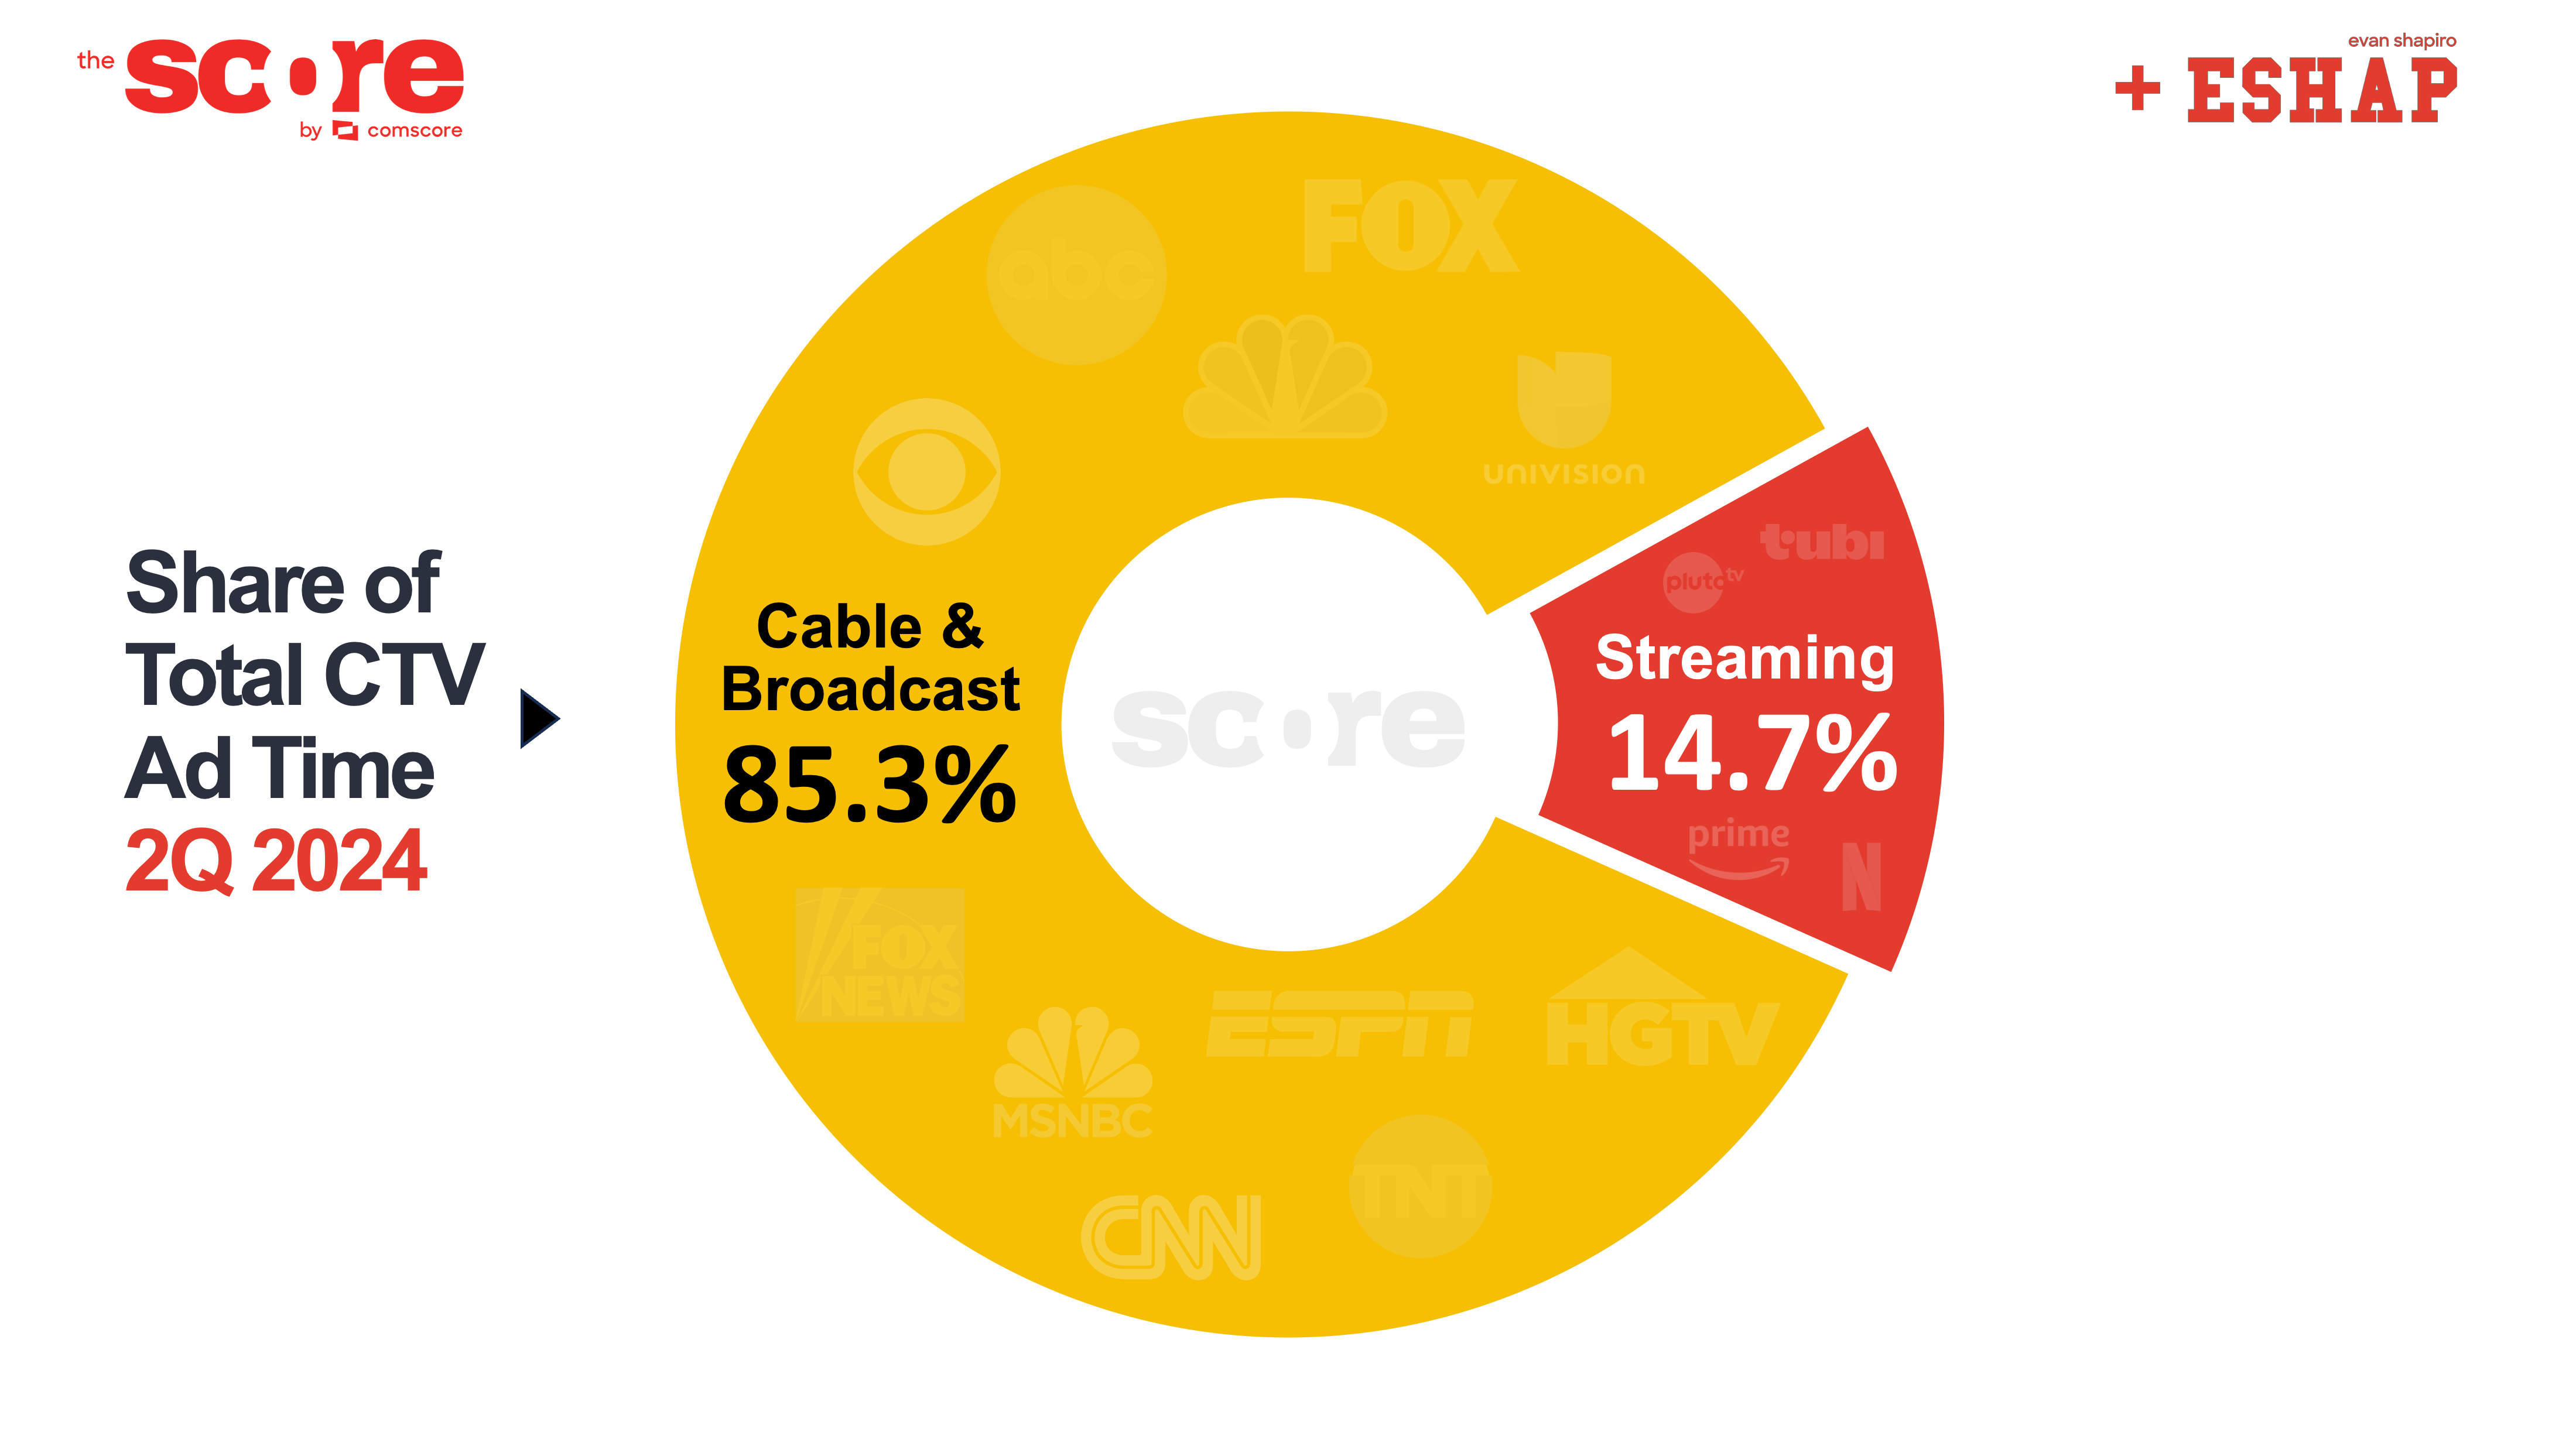
As a jaded New Yorker and Media War vet, I am rarely (if ever) surprised. But, I gotta say, the first time I saw the data from Comscore reporting share of ad voice for 2Q 2024, my actual jaw literally dropped. ICYMI, here’s that first chart again…

All the buzz these days is about Streaming. I get it - it’s the hot new thing, with Streaming audiences on CTV rising like piping hot sourdough bread. According to many reports, Streaming now regularly garners 40% or more of total monthly TV viewing. The problem with those reports? They give us no clue about how much of that viewing contains ad breaks that the agency community can buy and which the larger TV community can monetize. What this new data and brand new view of TV shows us is that the conventional buzz around Streaming misses one BIG point…
In 2Q 2024, the fact is that 85.3% of advertising on TV was viewed on Pay TV and Broadcast. Streaming in 2Q received just 14.7% of TV ads viewed.
You read that right. More than 85% of TV advertising is still seen on the combination of Pay and Broadcast television. There are myriad reasons for this.
The mass legacy of broadcast and the ingrained habit of cable TV combine to keep a tight hold on the vast majority of ad supported television time in the US. Obviously, streaming garners a large share of viewing on CTVs. But the ad tiers of the big SVODs are still immature, their churn is super high, and their inventory is quite limited. FAST and AVOD are coming on fast (pun intended), but much of their viewing remains fragmented - with notable exceptions, as the next chart illustrates. TL;DR… Despite tremendous audience migration in the last decade, traditional television services continue to retain much of television’s ad supported viewing and therefore demand much more of TV’s advertising dollars.
That 👆 was a huge ah-ha moment for me. When I dug further into the data, however, the ah-has kept coming…
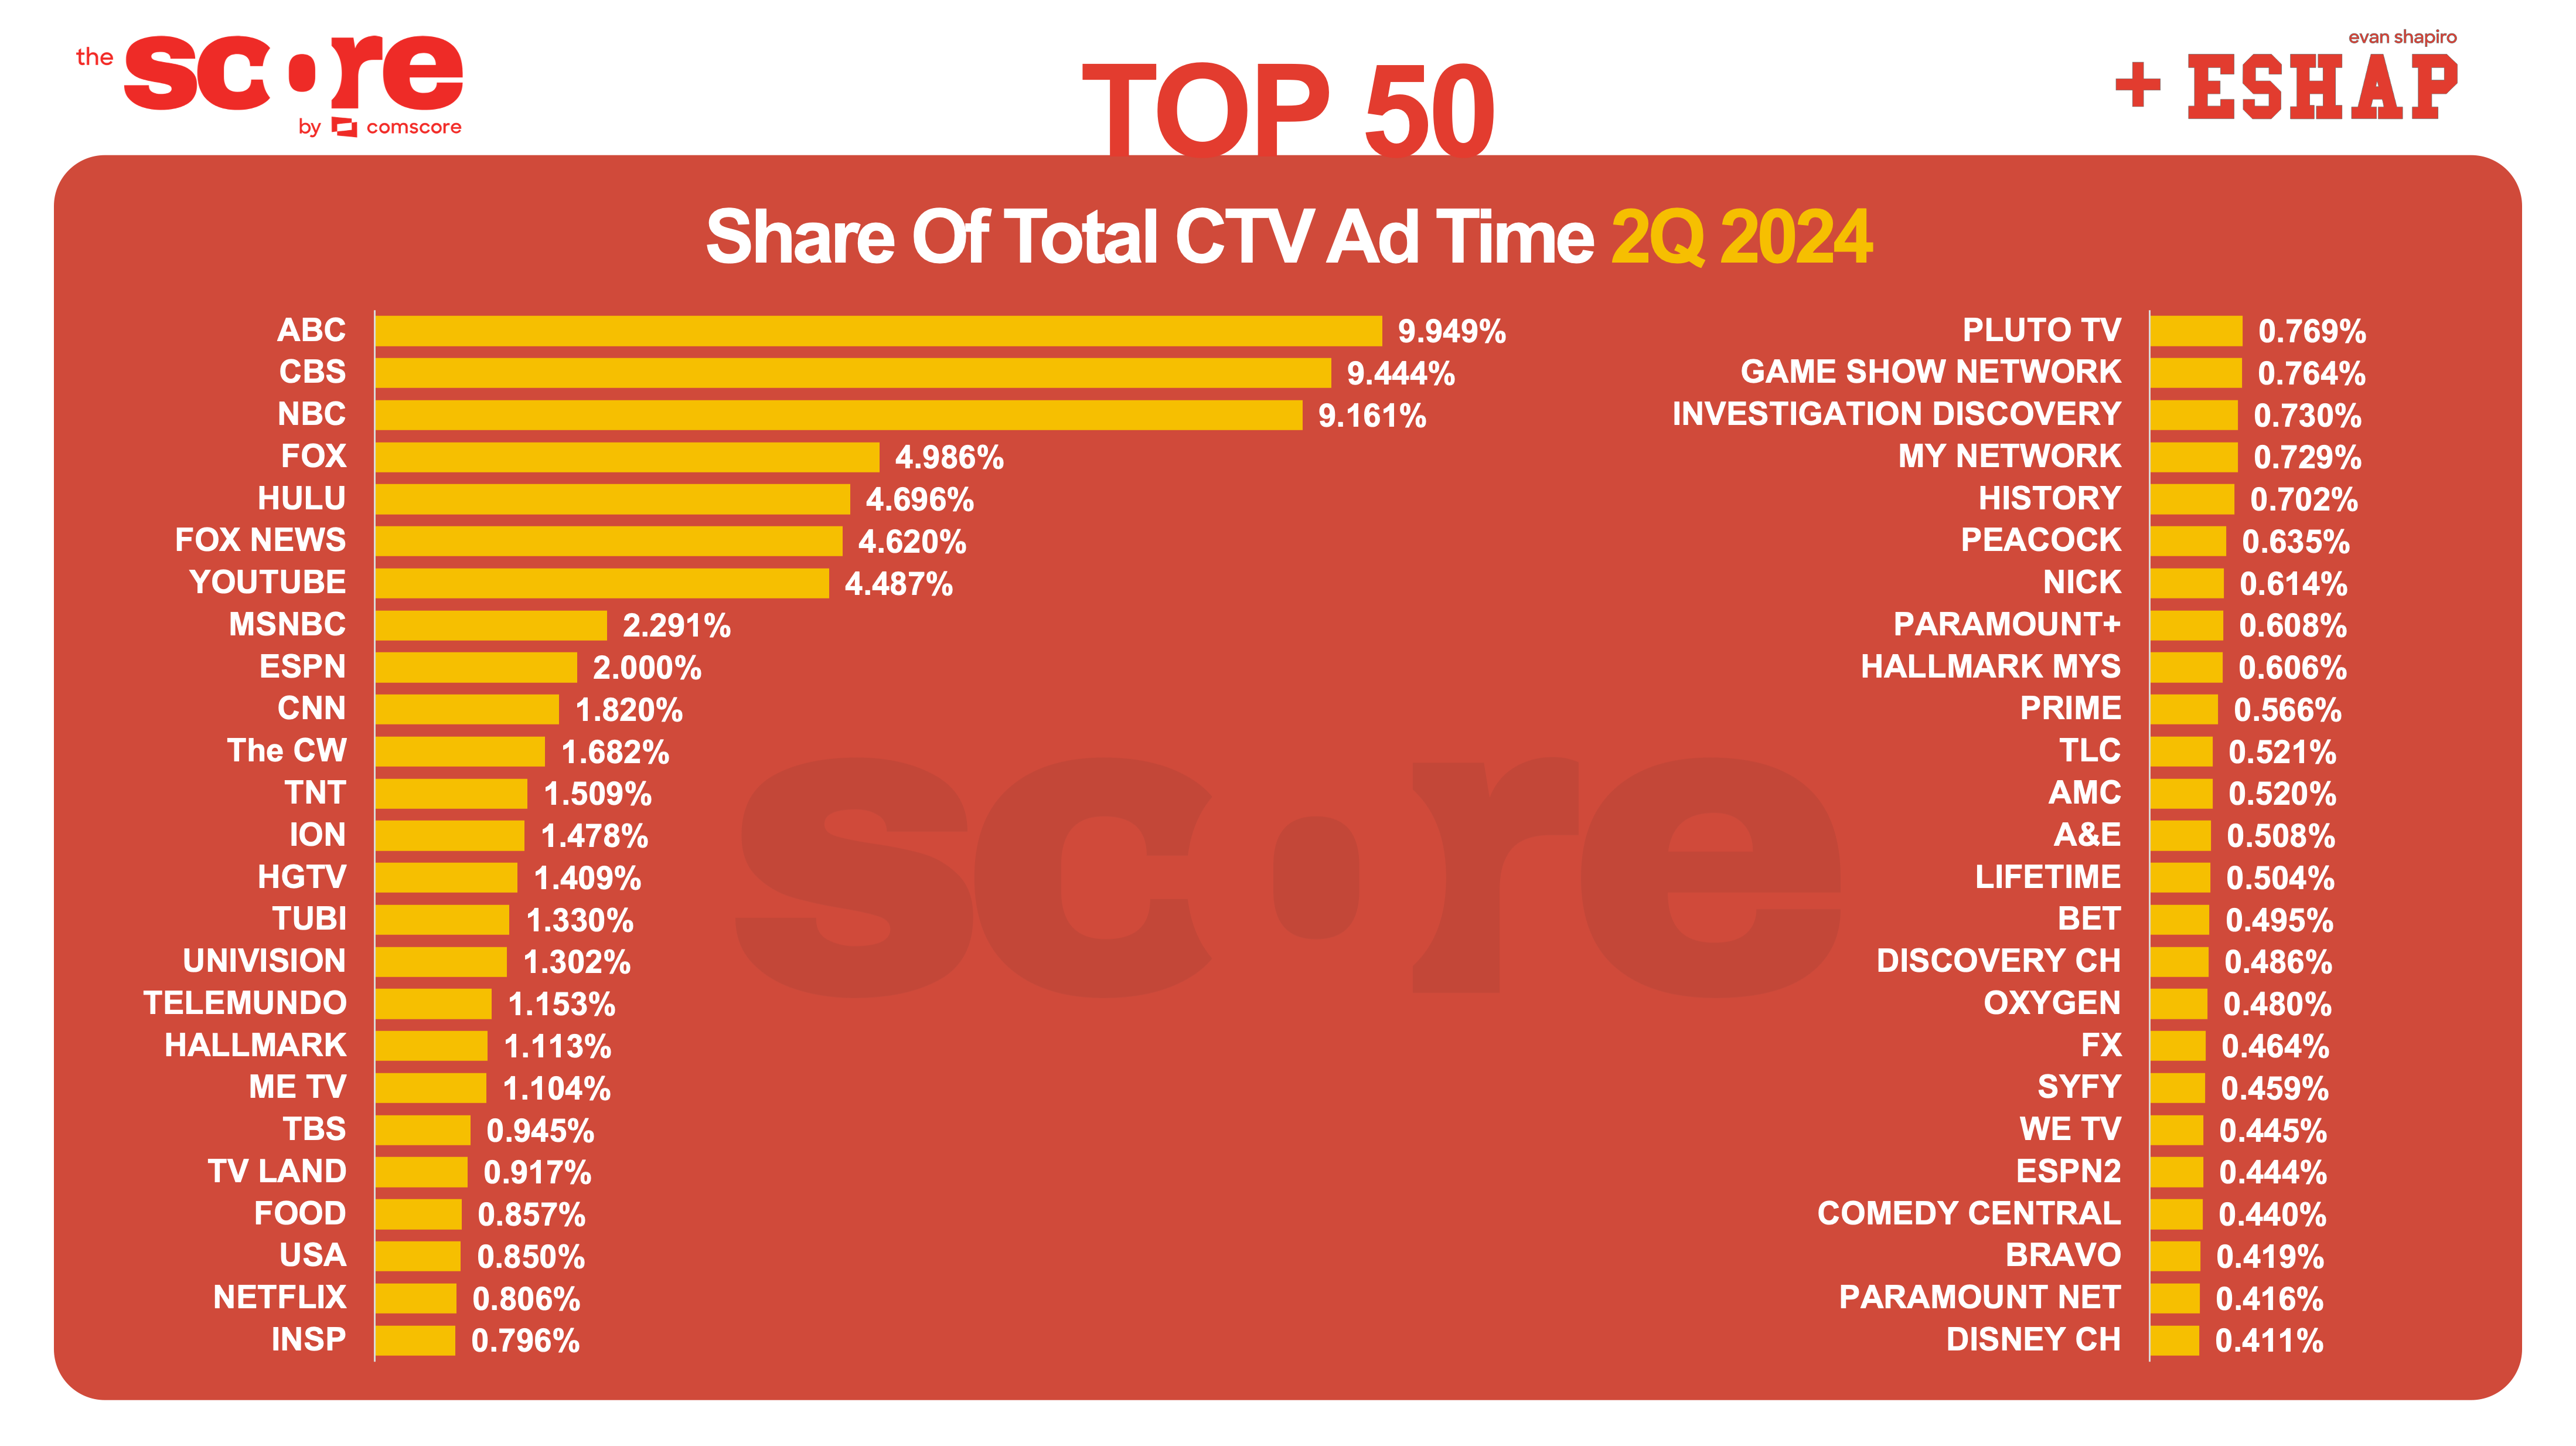
Broadcast networks’ vast reach and big ad muscles delivered more than a third of all ad supported CTV viewing in 2Q 2024. Despite this, though, Hulu was within striking distance of FOX TV’s total ad views - besting all of the cable TV networks.
On the other TV hand, Netflix’s ad tier - which launched two years ago - does not crack even 1% of total ad viewing. In April when Baby Reindeer dropped, and May when the latest Bridgerton binge hit, they did manage to rise above the 1% level for a few weeks. But for the entire quarter, Netflix averaged approximately six times less ad viewing than Hulu, which has 33 million fewer subscribers. Amazon, who debuted their new ad tier in January, scored just over 1/2 of 1% share of ad voice.
Tubi is not just the clear leader in FAST, FOX’s AVOD platform beats out broadcasters Univision and Telemundo, as well as major cablers like TBS, Food, and USA - rising above all the premium SVOD platforms with ad tiers. In fact…
Tubi’s share of ad voice in 2Q 2024 was 65% higher than Netflix and 135% bigger than Amazon Prime.
Pluto TV, landing at #26, tops SVOD players such as Paramount+ (its sister platform at #33), Peacock (#31), Prime (#35), Disney+ (#56), MAX (#86), and AMC+ (#173), as well as the rest of the FAST field, for the entire 2Q.
When you combine ABC, Hulu, and ESPN, Disney is the Mouse that roared for total share of TV ad voice. Disney tops all other competing Media companies with more than 20% of total share of TV ad voice. While FOX News continues to dominate Pay TV (making FOX Corp. a top tier player), Comcast has NBC and MSNBC in the Top 20, beating out FOX and creating a tight horserace for the biggest bite of the CTV advertising apple.
When counting eyeballs on ads, WBD fields cablers CNN (#10 on the list), TNT (#12), HGTV (#14), and TBS (#20) in the Top 20, putting them in fifth place among corporate platform conglomerates and edging out Google/YouTube. Moving forward, however, keep a watchful eye on YouTube, which is has evolved quickly from “social video” to “TV channel.” It is crucial to note that YouTube’s share of ad views in this report is just on the TV, trailing Hulu only by a nose and beating all Pay TV networks except Fox News.
Seeing Netflix and Amazon a distance behind competitors like Hallmark and ION shows how early in their ad supported lives they are. Conversely, Disney’s pole position, Google’s rising tide, and FOX’s Tubi speak to the increasing power of the streamers on CTV.
The mission of this new collab is to give you an accurate and useful understanding of CTV audiences, by introducing a new way of measuring them. Total viewing measurement without proper context does not help the ad buyers for whom television measurement is actually intended, nor the larger Media community who needs to monetize TV viewing now, more than ever.
The marketplace is chock full of studies and charts, data and reports. Our collective intent for The Score is not just to say some thing, but to say something. When it drops in a few weeks, the full report will offer deeper details such as month by month accounts of TV ad viewing, combined totals by corporate channel owners - the way ads are bought - as well as ad exposure on local channels.
As the battle over CTV ad cash intensifies, big tech companies ramp up their ad businesses, and television viewing continues to fragment and evolve, it is increasingly important to sort the data wheat from the measurement chaff and know where the audiences of television advertising are actually watching TV ads.
The full collab is coming at you soon! If you want to get it before everybody else, step up and become a Premium Peacenik subscriber.
Enjoy your week!
ESHAP