


All The Tea Vee

Hello from Amsterdam War & Peaceniks! Ready to cross the pond?
I'm jazzed to announce that I was recently commissioned by The Royal Television Society to create a Map of the UK Television Universe. For a Media Cartographer, it’s as close as I’ll ever get to being knighted. Today, I am unveiling the new map at IBC in Amsterdam with RTS CEO Theresa Wise. And now, I’m revealing it here, for you!
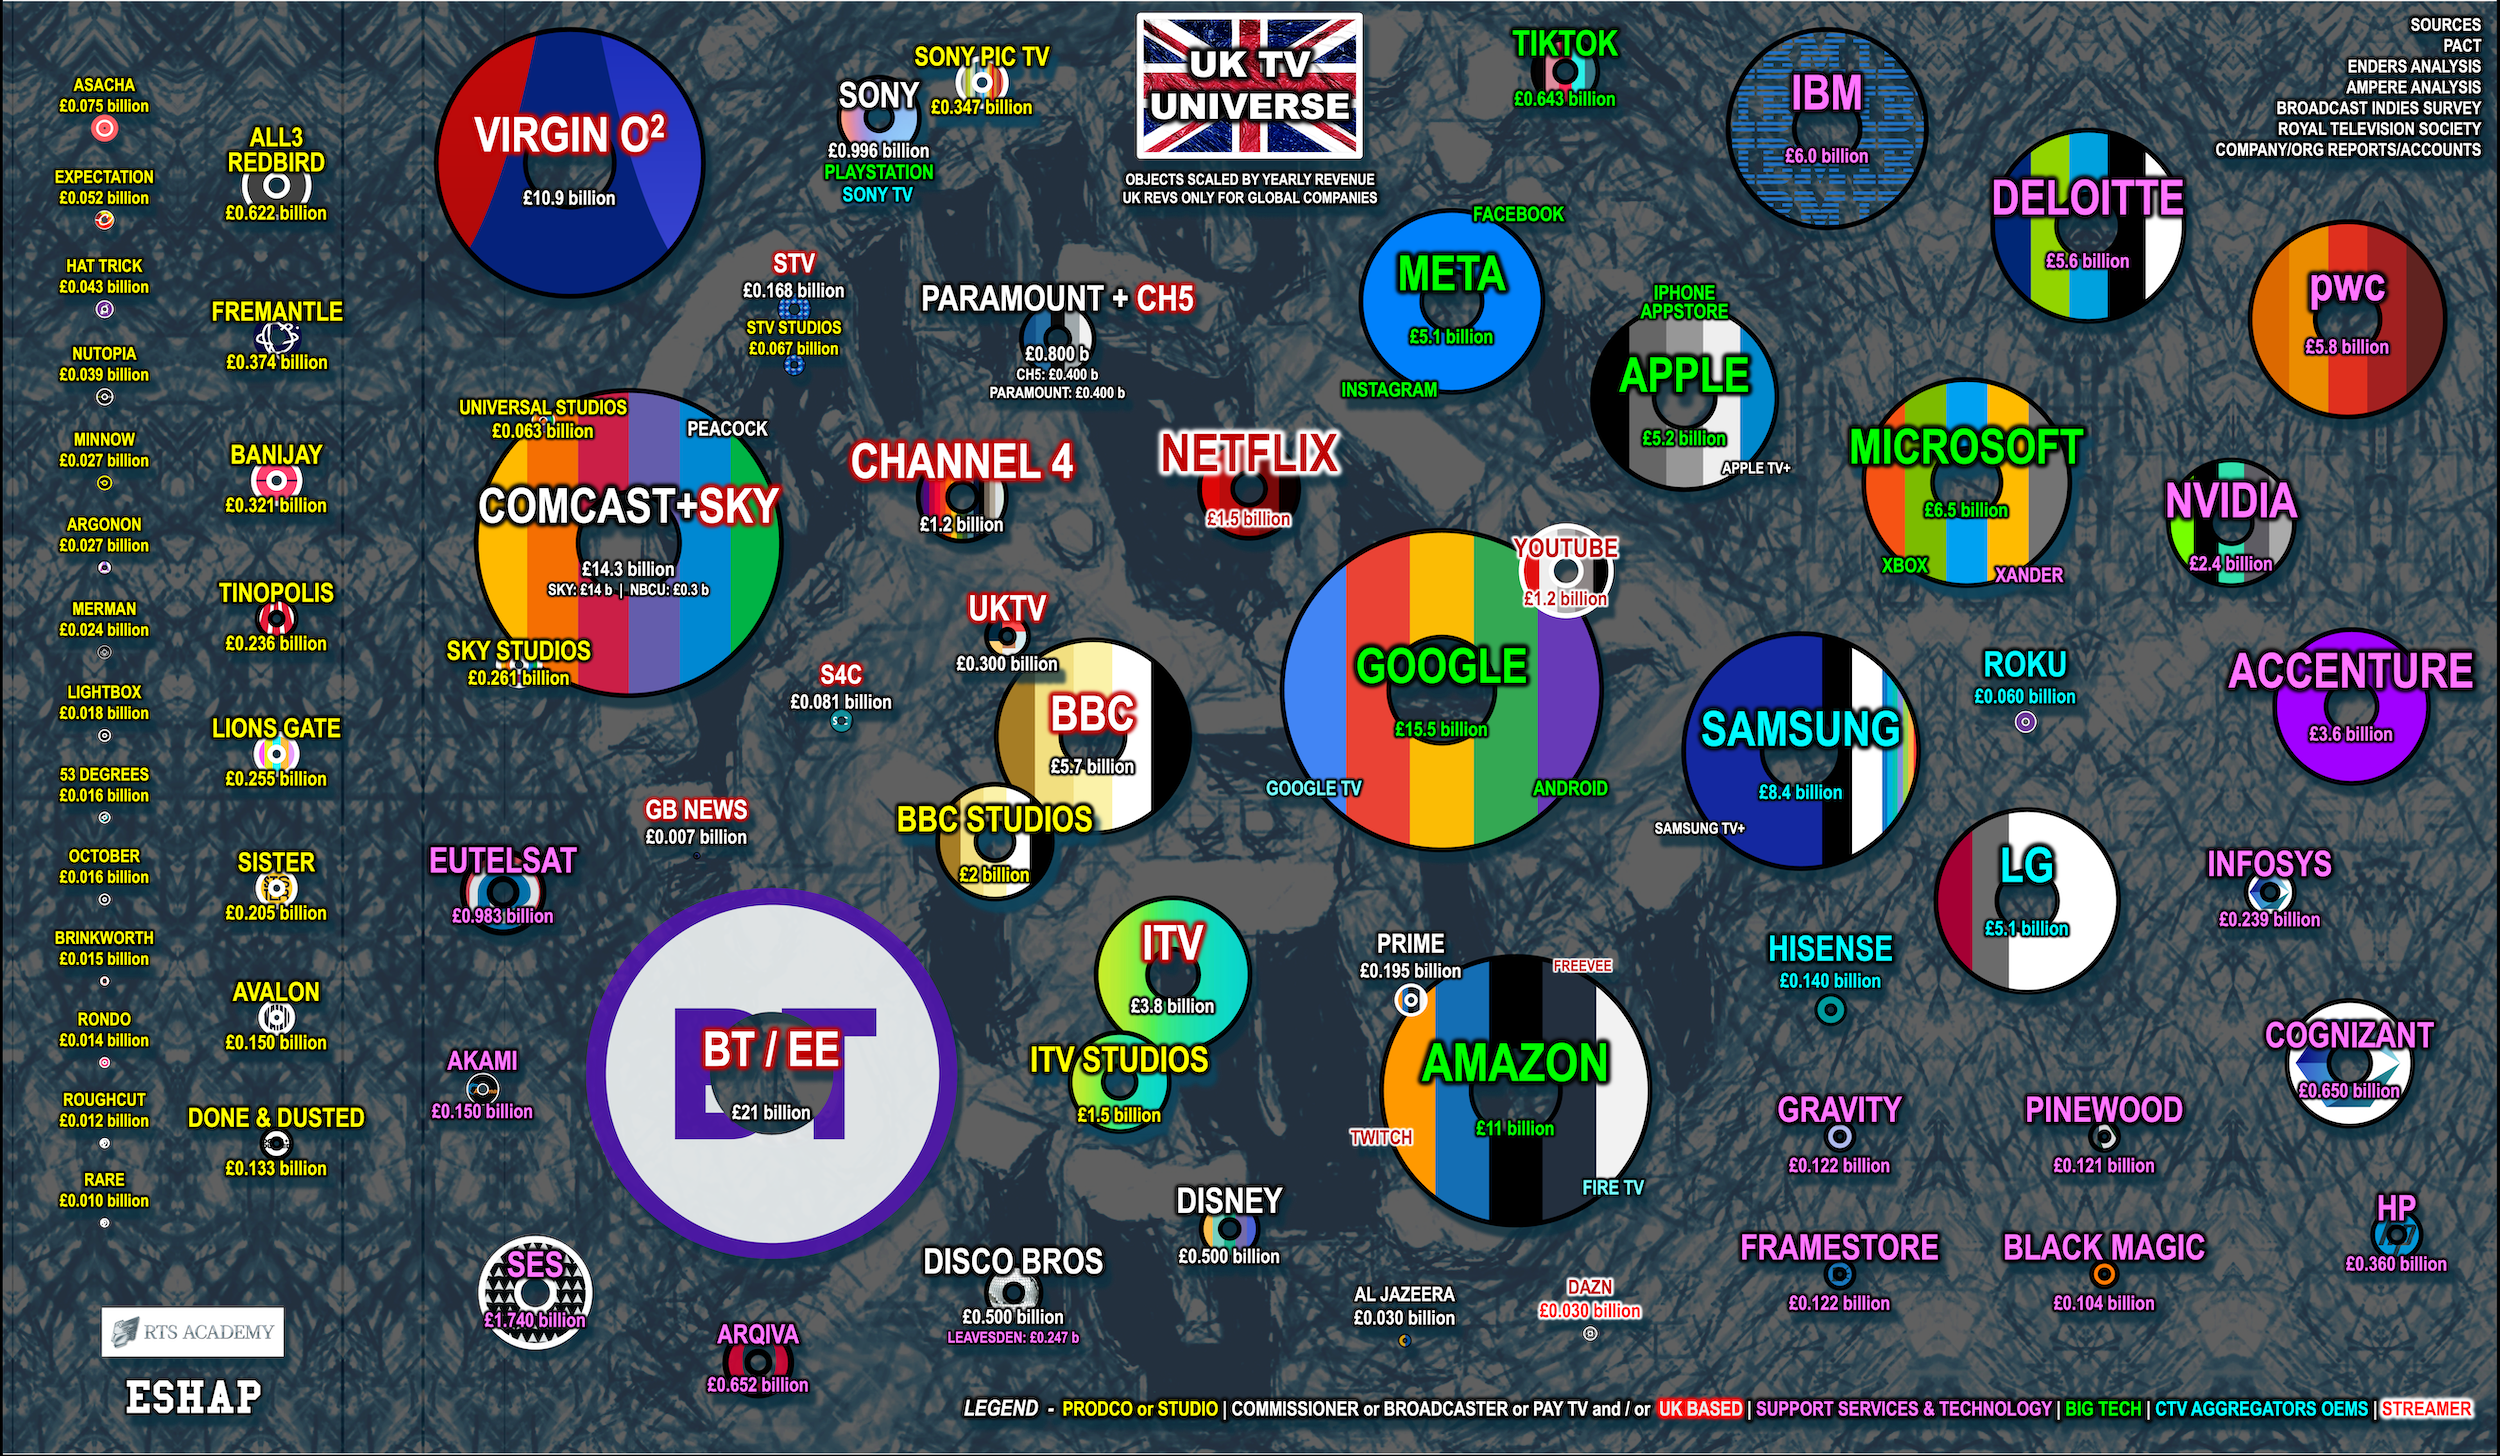
The organizations on the map are scaled by 2023 revenues. For UK-based companies, we used total revenues. For global companies operating in the UK (Google, Meta, Netflix, etc.) we used UK revenues only.
On the left, you’ll see all the independent UK production companies. As you move to the right, you’ll see the Pay TV providers (Sky, Virgin, EE/BT), then Commissioners and/or Broadcasters, including Paramount/Channel 5, Channel 4, ITV, and BBC. As you travel east on the map, you see global/US based Big Tech and Big Media (Disney, WBD/Disco Bros, Netflix, Google/YouTube, Amazon, Apple, etc.), then OEMs (Samsung, Roku), eventually landing on the right, with service providers of all shapes and sizes - from the famous Pinewood Studios, to consulting and back-end providers like Deloitte and Accenture as well as NVIDIA and Cognizant. (For aesthetic purposes I placed some service companies on the left, in the west.)
DOWNLOAD A HIGHER RES VERSION OF THE UK TV UNIVERSE MAP HERE.
There are some major players who have multi-faceted businesses, so their various segments are combined into multi-pronged planets. For example, Comcast includes Sky and Sky Studios; BBC encompasses their massive BBC studios, with revenues from around the globe; and Google’s incredible $15.5 billion in UK revenues obviously contains YouTube.
There’s so much to unpack on this map.
You can see the increasingly heated battle at the center of the map between native UK platforms/publishers and fast-growing US-based players such as Netflix and Google. In that context, it’s important to note that Netflix and YouTube now generate more money in the UK alone than Channel 4 and Channel 5, whereas Disney and Warner Brothers Discovery are still relatively small in the UK market. Amazon garners huge revenues in the UK, yet still relatively little from their video businesses there, whereas Meta is absolutely crushing it in the British Empire on just ads alone (Meta is here due to their huge social video business. Thus also TikTok).
Unlike the US, the UK has a massive and historic Public Service Media segment: the BBC, ITV, Channel 5, Channel 4, and SC4 (Scotland). These are free broadcasters protected in some ways by regulations and, in the case of the BBC, powered by public funding. This creates an enormously different competitive television landscape from what we know in America. Channel 4, ITV, and Channel 5 must generate their own revenues (primarily from advertising), which has been challenging of late, whereas the BBC receives more than £3 billion per year in license fees directly from the British public (they are required by law to be entirely ad free in the UK) and another £2 billion in commercial revenues from BBC Studios. There is also a storied yet shrinking Pay TV industry with Sky and their vast channel offerings (now owned by Comcast), as well as the major telecoms Virgin and EE/BT. This creates a very complicated and interesting environment as global (specifically American) Big Tech and Big Media increasingly compete in the UK TV universe for attention and revenues from the British public.
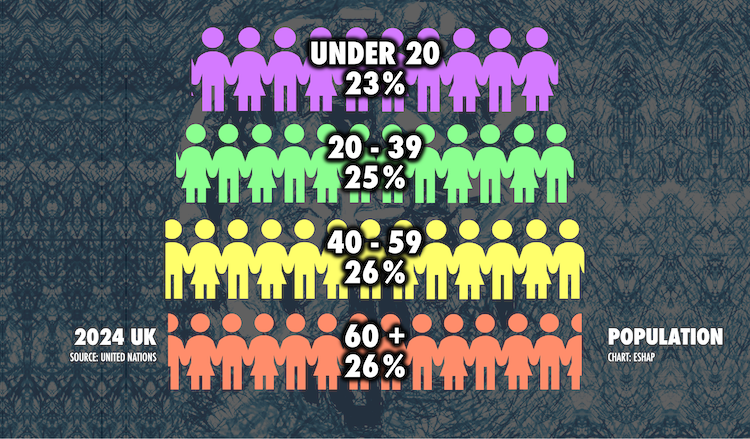
What’s more, the British population is older than America (and the rest of the world), thus their television habits are transforming more slowly that in the states.
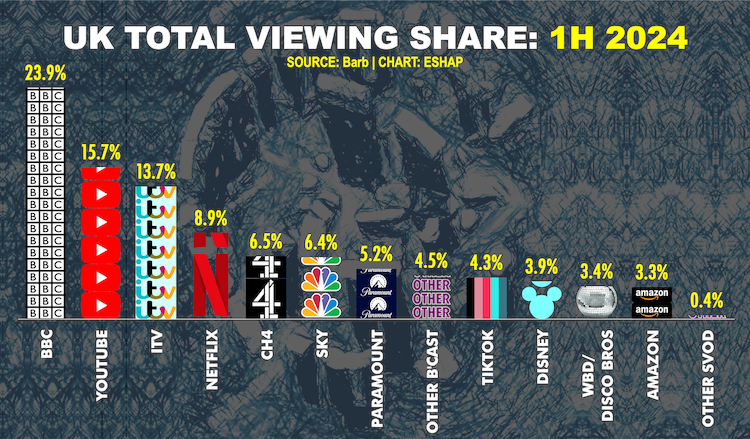
Beyond the edges of this map, as part of my presentation at IBC, I will also walk through a slew of data that makes up the foundational operations of the UK TV ecosystem. The data below is from Barb, the UK’s Joint Industry Committee that measures video audiences. Barb represents something the American TV industry desperately needs - a universally accepted source of measurement truth across platforms and screens. This chart 👇 includes viewership via Broadcast, Pay TV, and Social Video, on CTV, mobile, desktop, and tablets, and covers total identified viewing for the first half of 2024.
Keep reading with a 7-day free trial
Subscribe to Media War & Peace to keep reading this post and get 7 days of free access to the full post archives.